Search for Indicators
Black/African American Wellness Indicators
Roughly 3,200 Black/African American people call Santa Cruz County home. This dashboard shows data that can be disaggregated by race/ethnicity to provide more information on the health and wellness of Black/African American community members. Racism - both interpersonal and structural - results in conditions that unfairly advantage white communities and disadvantage Black/African American, Indigenous and People of Color (BIPOC) communities. The impact of centuries of racism in the United States has created inequities in access to a range of social and economic benefits - such as housing, education, wealth and employment - which has an impact on health equity. The health data in this dashboard shows disparities in some key areas - such as lower access to a usual source of health care, higher juvenile arrest rates and lower household income for Black/ African American community members in Santa Cruz County compared to the general population. Because of the influence of racism and small sample size, generally quantitative data is unable to provide the whole picture of health and wellness of Black/African American community members and data points must be interpreted with caution as rates can look more amplified than they are in actuality. We highly recommend critical local reports for a more nuanced understanding of health and wellness of Black/African American community in Santa Cruz, such as United Way's Santa Cruz County Black Health Matters Initiative Spotlight. Learn more about the impact of racism on health equity here.
Indicator Gauge Icon Legend
Legend Colors
Red is bad, green is good, blue is not statistically different/neutral.
Compared to Distribution
 the value is in the best half of communities.
 the value is in the 2nd worst quarter of communities.
 the value is in the worst quarter of communities.
Compared to Target
 meets target;
  does not meet target.
Compared to a Single Value
 lower than the comparison value;
 higher than the comparison value;
 not statistically different from comparison value.
Trend

 non-significant change over time;
 significant change over time;
  no change over time.
Compared to Prior Value
 higher than the previous measurement period;
 lower than the previous measurement period;
 no statistically different change from previous measurement period.
 Significantly better than the overall value
 Significantly worse than the overall value
 Significantly different than the overall value
 No significant difference with the overall value
 No data on significance available
Health / Alcohol & Drug Use
Health / Alcohol & Drug Use
County: Santa Cruz
Value
Compared to:
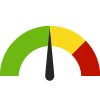
County: Santa Cruz Age-Adjusted Death Rate due to All Opioid Overdose
County: Santa Cruz Age-Adjusted Death Rate due to All Opioid Overdose
28.9
Rate per 100,000 residents
(2022)
Compared to:


CA Counties
The distribution is based on data from 58 California counties.
CA Value
(18.7)
The regional value is compared to the California state value.
Prior Value
(15.6)
Prior Value compares a measured value with the previously measured value. Confidence intervals were not taken into account in determining the direction of the comparison.
Trend
This comparison measures the indicator’s values over multiple time periods.<br>The Mann-Kendall Test for Statistical Significance is used to evaluate the trend<br>over 4 to 10 periods of measure, subject to data availability and comparability.
Health / Diabetes
Health / Diabetes
County: Santa Cruz
Value
Compared to:
County: Santa Cruz Diabetic Monitoring: Medicare Population
County: Santa Cruz Diabetic Monitoring: Medicare Population
87.8%
(2019)
Compared to:
CA Counties
The distribution is based on data from 58 California counties.
U.S. Counties
The distribution is based on data from 3,097 U.S. counties and county equivalents.
CA Value
(84.4%)
The regional value is compared to the California state value.
US Value
(87.5%)
The regional value is compared to the national value.
Prior Value
(89.8%)
Prior Value compares a measured value with the previously measured value. Confidence intervals were taken into account in determining the direction of the comparison.
Trend
This comparison measures the indicator’s values over multiple time periods.<br>The Mann-Kendall Test for Statistical Significance is used to evaluate the trend<br>over 4 to 10 periods of measure, subject to data availability and comparability.
Health / Health Care Access & Quality
Health / Health Care Access & Quality
County: Santa Cruz
Value
Compared to:
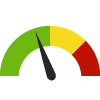
County: Santa Cruz People with a Usual Source of Health Care
County: Santa Cruz People with a Usual Source of Health Care
84.5%
(2022)
Compared to:

CA Counties
The distribution is based on data from 58 California counties.
CA Value
(82.5%)
The regional value is compared to the California state value.
Prior Value
(88.0%)
Prior Value compares a measured value with the previously measured value. Confidence intervals were taken into account in determining the direction of the comparison.
Trend
This comparison measures the indicator’s values over multiple time periods.<br>The Mann-Kendall Test for Statistical Significance is used to evaluate the trend<br>over 4 to 10 periods of measure, subject to data availability and comparability.
Health / Health Information Technology
Health / Health Information Technology
County: Santa Cruz
Value
Compared to:
County: Santa Cruz Persons with an Internet Subscription
County: Santa Cruz Persons with an Internet Subscription
94.2%
(2018-2022)
Compared to:
CA Counties
The distribution is based on data from 58 California counties.
U.S. Counties
The distribution is based on data from 3,133 U.S. counties and county equivalents.
CA Value
(93.4%)
The regional value is compared to the California state value.
US Value
(91.0%)
The regional value is compared to the national value.
Trend
This comparison measures the indicator’s values over multiple time periods.<br>The Mann-Kendall Test for Statistical Significance is used to evaluate the trend<br>over 4 to 10 periods of measure, subject to data availability and comparability.
Health / Mortality Data
Health / Mortality Data
County: Santa Cruz
Value
Compared to:
County: Santa Cruz Life Expectancy
County: Santa Cruz Life Expectancy
82.1
Years
(2019-2021)
Compared to:
CA Counties
The distribution is based on data from 57 California counties.
U.S. Counties
The distribution is based on data from 3,070 U.S. counties and county equivalents.
CA Value
(79.9)
The regional value is compared to the California state value.
US Value
(77.6)
The regional value is compared to the national value.
Health / Older Adults
Health / Older Adults
County: Santa Cruz
Value
Compared to:
County: Santa Cruz Adults 65+ with a Disability
County: Santa Cruz Adults 65+ with a Disability
28.8%
(2018-2022)
Compared to:


CA Value
(33.5%)
The regional value is compared to the California state value.
US Value
(33.3%)
The regional value is compared to the national value.
Trend
This comparison measures the indicator’s values over multiple time periods.<br>The Mann-Kendall Test for Statistical Significance is used to evaluate the trend<br>over 4 to 10 periods of measure, subject to data availability and comparability.
Community / Crime & Crime Prevention
Community / Crime & Crime Prevention
County: Santa Cruz
Value
Compared to:
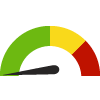
County: Santa Cruz Adult Arrest Rate
County: Santa Cruz Adult Arrest Rate
38.7
Arrests per 1,000 population 18+
(2022)
Compared to:

CA Counties
The distribution is based on data from 58 California counties.
CA Value
(25.1)
The regional value is compared to the California state value.
Prior Value
(38.1)
Prior Value compares a measured value with the previously measured value. Confidence intervals were not taken into account in determining the direction of the comparison.
Trend
This comparison measures the indicator’s values over multiple time periods.<br>The Mann-Kendall Test for Statistical Significance is used to evaluate the trend<br>over 4 to 10 periods of measure, subject to data availability and comparability.
County: Santa Cruz Deaths in Custody
County: Santa Cruz Deaths in Custody
0.2
Per 10,000 population
(2019)
Compared to:
CA Value
(0.2)
The regional value is compared to the California state value.
County: Santa Cruz Juvenile Arrest Rate
County: Santa Cruz Juvenile Arrest Rate
5.4
Arrests per 1,000 population aged 0-17
(2022)
Compared to:
CA Counties
The distribution is based on data from 57 California counties.
CA Value
(2.8)
The regional value is compared to the California state value.
Prior Value
(3.4)
Prior Value compares a measured value with the previously measured value. Confidence intervals were not taken into account in determining the direction of the comparison.
Trend
This comparison measures the indicator’s values over multiple time periods.<br>The Mann-Kendall Test for Statistical Significance is used to evaluate the trend<br>over 4 to 10 periods of measure, subject to data availability and comparability.
Community / Transportation
Community / Transportation
County: Santa Cruz
Value
Compared to:
County: Santa Cruz Workers Commuting by Public Transportation
County: Santa Cruz Workers Commuting by Public Transportation
1.8%
(2018-2022)
Compared to:

CA Counties
The distribution is based on data from 58 California counties.
U.S. Counties
(2015-2019)
The distribution is based on data from 3,142 U.S. counties and county equivalents.
CA Value
(3.6%)
The regional value is compared to the California state value.
US Value
(3.8%)
The regional value is compared to the national value.
Trend
This comparison measures the indicator’s values over multiple time periods.<br>The Mann-Kendall Test for Statistical Significance is used to evaluate the trend<br>over 4 to 10 periods of measure, subject to data availability and comparability.
HP 2030 Target
(5.3%)
County: Santa Cruz Workers who Drive Alone to Work
County: Santa Cruz Workers who Drive Alone to Work
64.2%
(2018-2022)
Compared to:
CA Counties
The distribution is based on data from 58 California counties.
U.S. Counties
The distribution is based on data from 3,133 U.S. counties and county equivalents.
CA Value
(68.4%)
The regional value is compared to the California state value.
US Value
(71.7%)
The regional value is compared to the national value.
Trend
This comparison measures the indicator’s values over multiple time periods.<br>The Mann-Kendall Test for Statistical Significance is used to evaluate the trend<br>over 4 to 10 periods of measure, subject to data availability and comparability.
County: Santa Cruz Workers who Walk to Work
County: Santa Cruz Workers who Walk to Work
4.6%
(2018-2022)
Compared to:
CA Counties
The distribution is based on data from 58 California counties.
U.S. Counties
The distribution is based on data from 3,133 U.S. counties and county equivalents.
CA Value
(2.4%)
The regional value is compared to the California state value.
US Value
(2.4%)
The regional value is compared to the national value.
Trend
This comparison measures the indicator’s values over multiple time periods.<br>The Mann-Kendall Test for Statistical Significance is used to evaluate the trend<br>over 4 to 10 periods of measure, subject to data availability and comparability.
Economy / Income
Economy / Income
County: Santa Cruz
Value
Compared to:
County: Santa Cruz Median Household Income
County: Santa Cruz Median Household Income
$104,409
(2018-2022)
Compared to:
CA Counties
The distribution is based on data from 58 California counties.
U.S. Counties
The distribution is based on data from 3,132 U.S. counties and county equivalents.
CA Value
($91,905)
The regional value is compared to the California state value.
US Value
($75,149)
The regional value is compared to the national value.
Trend
This comparison measures the indicator’s values over multiple time periods.<br>The Mann-Kendall Test for Statistical Significance is used to evaluate the trend<br>over 4 to 10 periods of measure, subject to data availability and comparability.
County: Santa Cruz Per Capita Income
County: Santa Cruz Per Capita Income
$52,887
(2018-2022)
Compared to:
CA Counties
The distribution is based on data from 58 California counties.
U.S. Counties
The distribution is based on data from 3,133 U.S. counties and county equivalents.
CA Value
($45,591)
The regional value is compared to the California state value.
US Value
($41,261)
The regional value is compared to the national value.
Trend
This comparison measures the indicator’s values over multiple time periods.<br>The Mann-Kendall Test for Statistical Significance is used to evaluate the trend<br>over 4 to 10 periods of measure, subject to data availability and comparability.
Economy / Poverty
Economy / Poverty
County: Santa Cruz
Value
Compared to:
County: Santa Cruz Children Living Below Poverty Level
County: Santa Cruz Children Living Below Poverty Level
10.9%
(2018-2022)
Compared to:

CA Counties
The distribution is based on data from 58 California counties.
U.S. Counties
The distribution is based on data from 3,132 U.S. counties and county equivalents.
CA Value
(15.6%)
The regional value is compared to the California state value.
US Value
(16.7%)
The regional value is compared to the national value.
Trend
This comparison measures the indicator’s values over multiple time periods.<br>The Mann-Kendall Test for Statistical Significance is used to evaluate the trend<br>over 4 to 10 periods of measure, subject to data availability and comparability.
County: Santa Cruz Families Living Below Poverty Level
County: Santa Cruz Families Living Below Poverty Level
6.2%
(2018-2022)
Compared to:
CA Counties
The distribution is based on data from 58 California counties.
U.S. Counties
The distribution is based on data from 3,104 U.S. counties and county equivalents.
CA Value
(8.5%)
The regional value is compared to the California state value.
US Value
(8.8%)
The regional value is compared to the national value.
Trend
This comparison measures the indicator’s values over multiple time periods.<br>The Mann-Kendall Test for Statistical Significance is used to evaluate the trend<br>over 4 to 10 periods of measure, subject to data availability and comparability.
County: Santa Cruz People 65+ Living Below Poverty Level
County: Santa Cruz People 65+ Living Below Poverty Level
8.3%
(2018-2022)
Compared to:

CA Counties
The distribution is based on data from 58 California counties.
U.S. Counties
The distribution is based on data from 3,133 U.S. counties and county equivalents.
CA Value
(11.0%)
The regional value is compared to the California state value.
US Value
(10.0%)
The regional value is compared to the national value.
Trend
This comparison measures the indicator’s values over multiple time periods.<br>The Mann-Kendall Test for Statistical Significance is used to evaluate the trend<br>over 4 to 10 periods of measure, subject to data availability and comparability.
County: Santa Cruz People Living Below Poverty Level
County: Santa Cruz People Living Below Poverty Level
11.4%
(2018-2022)
Compared to:
CA Counties
The distribution is based on data from 58 California counties.
U.S. Counties
The distribution is based on data from 3,133 U.S. counties and county equivalents.
CA Value
(12.1%)
The regional value is compared to the California state value.
US Value
(12.5%)
The regional value is compared to the national value.
Trend
This comparison measures the indicator’s values over multiple time periods.<br>The Mann-Kendall Test for Statistical Significance is used to evaluate the trend<br>over 4 to 10 periods of measure, subject to data availability and comparability.
HP 2030 Target
(8.0%)
Education / Educational Attainment
Education / Educational Attainment
County: Santa Cruz
Value
Compared to:
County: Santa Cruz People 25+ with a Bachelor's Degree or Higher
County: Santa Cruz People 25+ with a Bachelor's Degree or Higher
42.5%
(2018-2022)
Compared to:
CA Counties
The distribution is based on data from 58 California counties.
U.S. Counties
The distribution is based on data from 3,133 U.S. counties and county equivalents.
CA Value
(35.9%)
The regional value is compared to the California state value.
US Value
(34.3%)
The regional value is compared to the national value.
Trend
This comparison measures the indicator’s values over multiple time periods.<br>The Mann-Kendall Test for Statistical Significance is used to evaluate the trend<br>over 4 to 10 periods of measure, subject to data availability and comparability.
County: Santa Cruz People 25+ with a High School Diploma or Higher
County: Santa Cruz People 25+ with a High School Diploma or Higher
88.7%
(2018-2022)
Compared to:
CA Counties
The distribution is based on data from 58 California counties.
U.S. Counties
The distribution is based on data from 3,133 U.S. counties and county equivalents.
CA Value
(84.4%)
The regional value is compared to the California state value.
US Value
(89.1%)
The regional value is compared to the national value.
Trend
This comparison measures the indicator’s values over multiple time periods.<br>The Mann-Kendall Test for Statistical Significance is used to evaluate the trend<br>over 4 to 10 periods of measure, subject to data availability and comparability.
