Search for Indicators
Transportation
Public transportation offers mobility to U.S. residents, particularly people without cars. Transit can help bridge the spatial divide between people and jobs, services, and training opportunities. Public transportation is also beneficial because it reduces fuel consumption, minimizes air pollution, and relieves traffic congestion.
- The mean travel time to to work is 27.5 minutes - overtime this value has continued to increase - this is worse than 50% of other CA counties.
- 2.2% of workers commute by public transportation; this is higher among 16-24 year olds.
- Consumer expenditures for local public transportation is higher and worse when compared to both CA Counties and US Counties
- 68% of workers drive alone to work. This trend has been decreasing since 2009.
- The longest mean travel times to work are experienced by residents in the San Lorenzo Valley (36.8 minutes) followed by Mid-County, South County and lastly, North County (25.6 minutes)
- About 8% of workers in North County walk to work compared to roughly 2% in South County and the San Lorenzo Valley.
Focus On
Learn More
Transportation
Explore the data to learn more about transportation in Santa Cruz County.

Vision Zero is a world-wide strategy to eliminate all traffic fatalities and severe injuries to ensure safe, healthy, equitable mobility for all.
Learn More
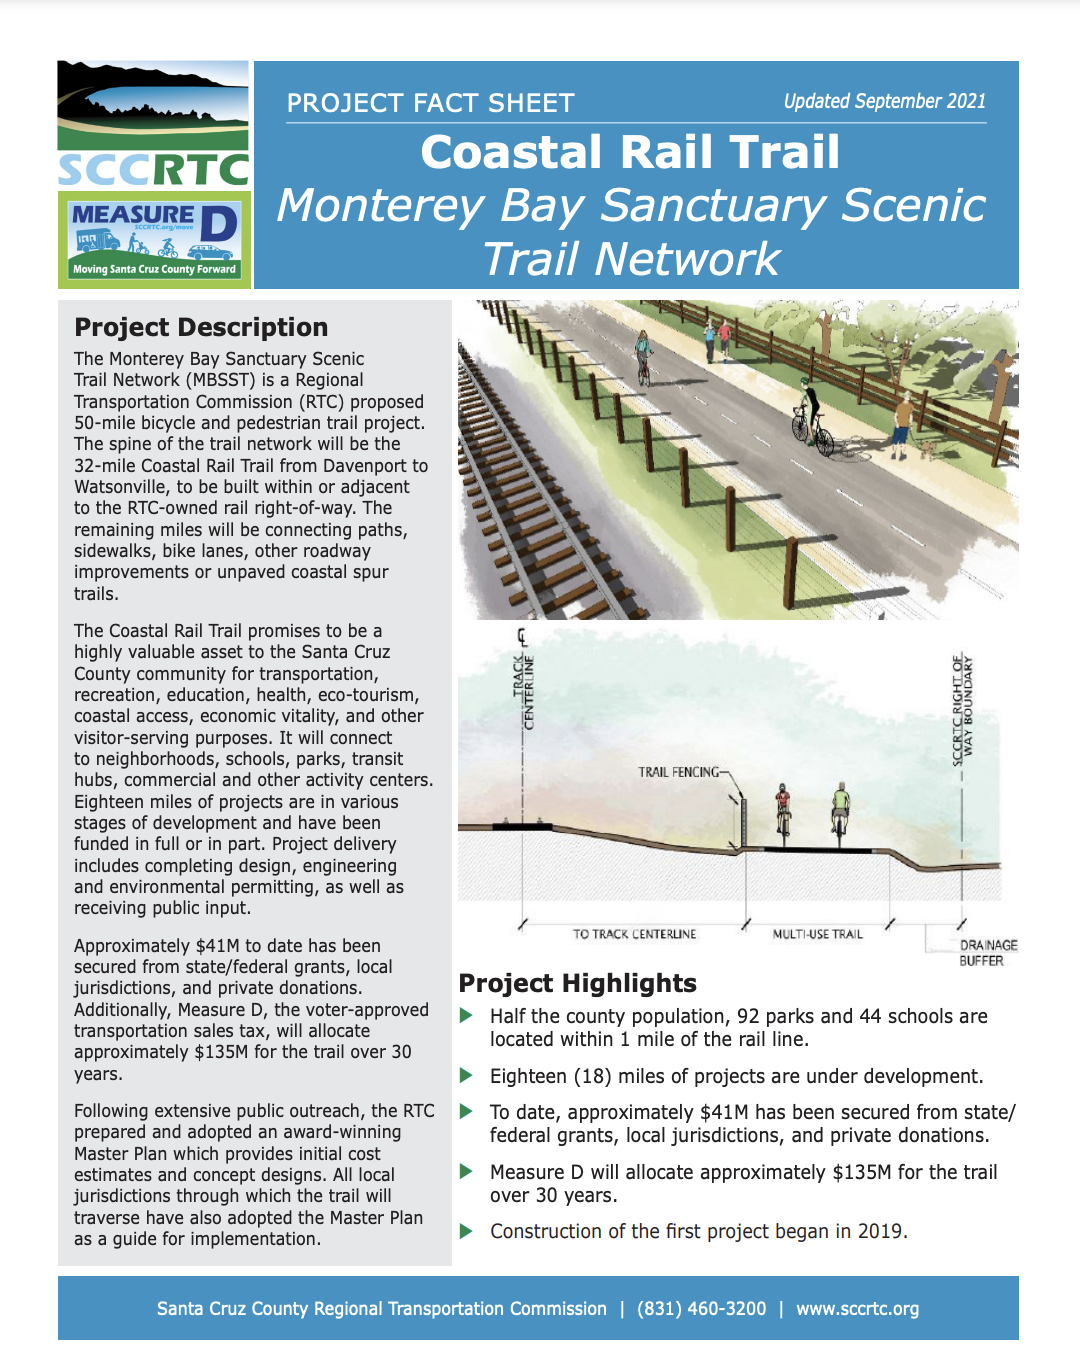
The Monterey Bay Sanctuary Scenic Trail Network is a regional transportation commission proposed 50-mile bicycle and pedestrian trail project.
Learn More
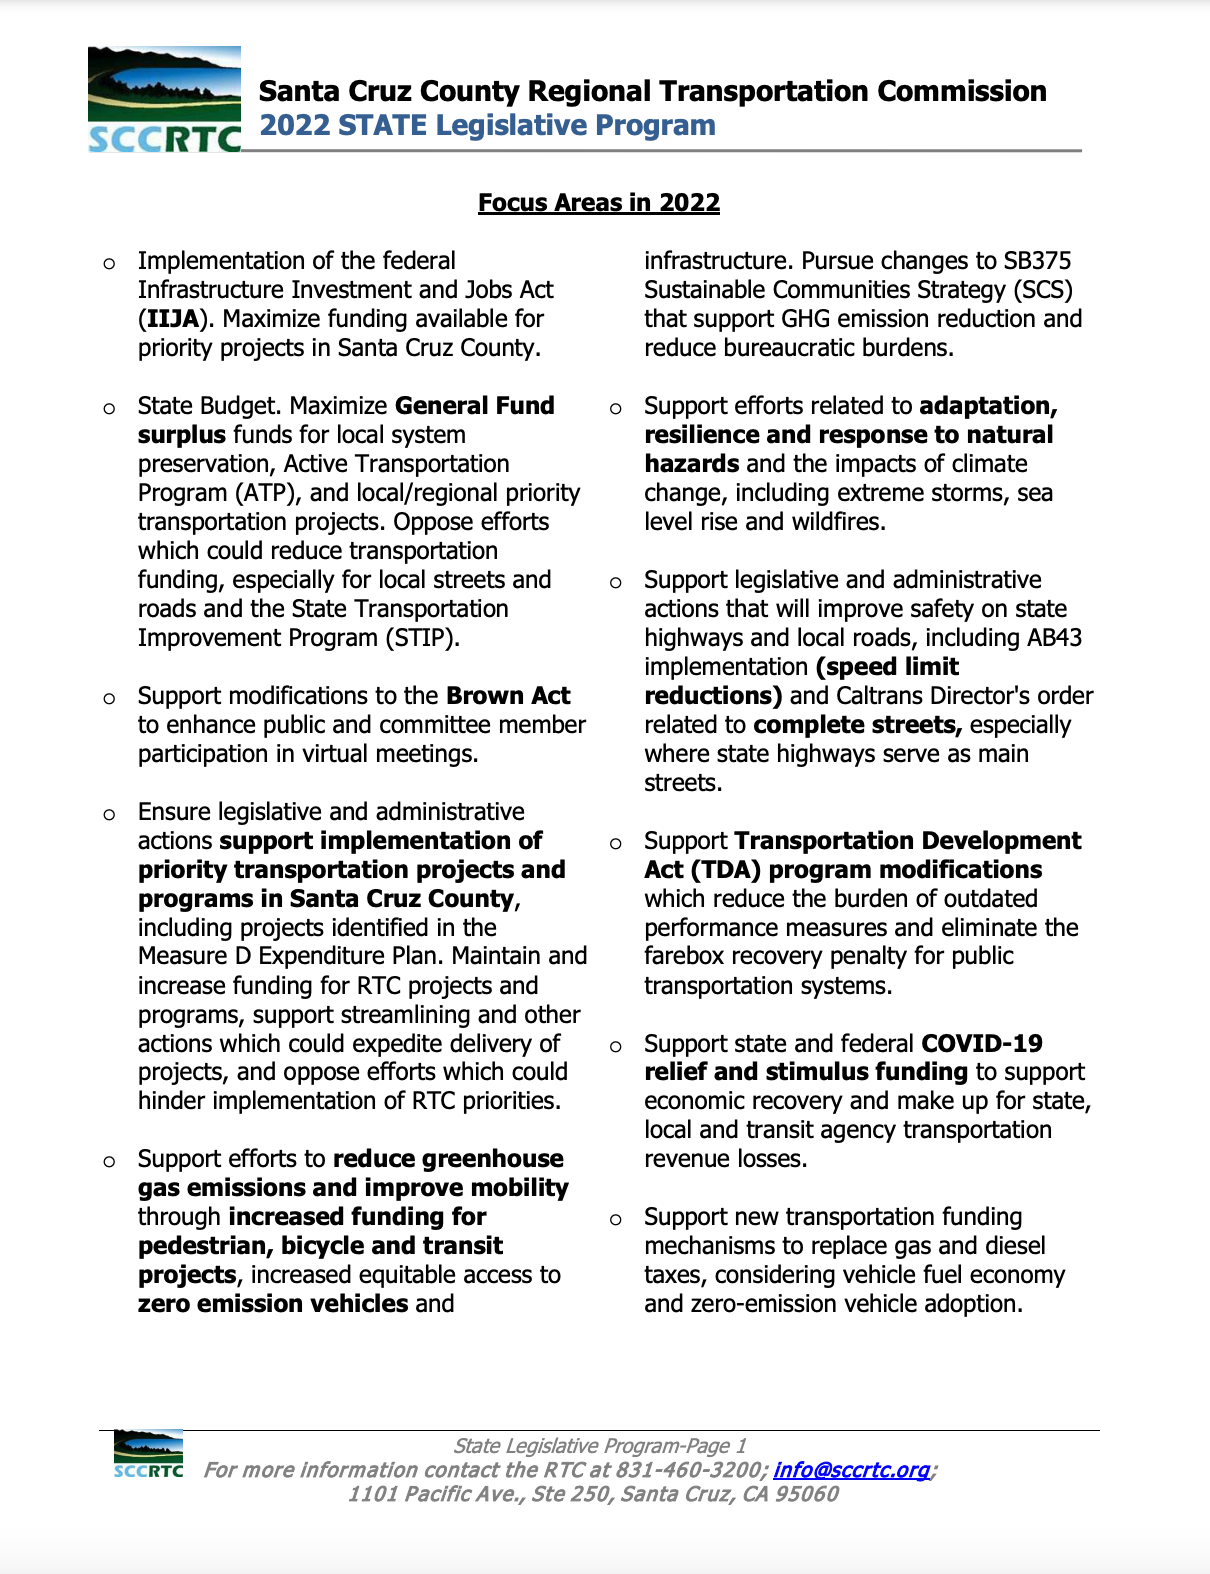
This legislative program gives an overview of the focus areas and ongoing priorities for 2022.
Learn More
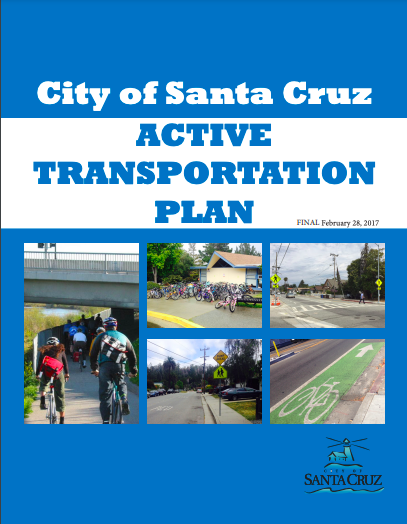
The Active Transportation Plan identifies an integrated network of walkways and bikeways that connect the City of Santa Cruz neighborhoods and communities to employment, recreation, education and destinations that meet their daily needs.
Learn More

Recommendations for improving safety at the 15 public schools of the Pajaro Valley Unified School District (PVUSD) located in the City of Watsonville. The Plan includes a prioritized list of conceptual infrastructure improvements and recommendations for education and encouragement programs intended to improve the safety of families while walking and biking and to encourage more active transportation trips to school
Learn More

Ecology Action Impact Report shares impact summaries on programs and advocacy.
Indicator Gauge Icon Legend
Legend Colors
Red is bad, green is good, blue is not statistically different/neutral.
Compared to Distribution
 the value is in the best half of communities.
 the value is in the 2nd worst quarter of communities.
 the value is in the worst quarter of communities.
Compared to Target
 meets target;
  does not meet target.
Compared to a Single Value
 lower than the comparison value;
 higher than the comparison value;
 not statistically different from comparison value.
Trend

 non-significant change over time;
 significant change over time;
  no change over time.
Compared to Prior Value
 higher than the previous measurement period;
 lower than the previous measurement period;
 no statistically different change from previous measurement period.
Community / Transportation
Mean Travel Time to Work Region: Mid-County
Mean Travel Time to Work Region: Mid-County
28.2
Minutes
(2018-2022)
Compared to:


CA Counties
The distribution is based on data from 58 California counties.
U.S. Counties
The distribution is based on data from 3,131 U.S. counties and county equivalents.
Santa Cruz, CA County Value
(26.7)
The regional value is compared to the Santa Cruz County value.
CA Value
(29.2)
The regional value is compared to the California state value.
US Value
(26.7)
The regional value is compared to the national value.
Trend
This comparison measures the indicator’s values over multiple time periods.<br>The Mann-Kendall Test for Statistical Significance is used to evaluate the trend<br>over 4 to 10 periods of measure, subject to data availability and comparability.
Mean Travel Time to Work Region: North County
Mean Travel Time to Work Region: North County
24.0
Minutes
(2018-2022)
Compared to:


CA Counties
The distribution is based on data from 58 California counties.
U.S. Counties
The distribution is based on data from 3,131 U.S. counties and county equivalents.
Santa Cruz, CA County Value
(26.7)
The regional value is compared to the Santa Cruz County value.
CA Value
(29.2)
The regional value is compared to the California state value.
US Value
(26.7)
The regional value is compared to the national value.
Trend
This comparison measures the indicator’s values over multiple time periods.<br>The Mann-Kendall Test for Statistical Significance is used to evaluate the trend<br>over 4 to 10 periods of measure, subject to data availability and comparability.
Mean Travel Time to Work Region: San Lorenzo Valley
Mean Travel Time to Work Region: San Lorenzo Valley
36.0
Minutes
(2018-2022)
Compared to:

CA Counties
The distribution is based on data from 58 California counties.
U.S. Counties
The distribution is based on data from 3,131 U.S. counties and county equivalents.
Santa Cruz, CA County Value
(26.7)
The regional value is compared to the Santa Cruz County value.
CA Value
(29.2)
The regional value is compared to the California state value.
US Value
(26.7)
The regional value is compared to the national value.
Trend
This comparison measures the indicator’s values over multiple time periods.<br>The Mann-Kendall Test for Statistical Significance is used to evaluate the trend<br>over 4 to 10 periods of measure, subject to data availability and comparability.
Mean Travel Time to Work Region: South County
Mean Travel Time to Work Region: South County
27.7
Minutes
(2018-2022)
Compared to:


CA Counties
The distribution is based on data from 58 California counties.
U.S. Counties
The distribution is based on data from 3,131 U.S. counties and county equivalents.
Santa Cruz, CA County Value
(26.7)
The regional value is compared to the Santa Cruz County value.
CA Value
(29.2)
The regional value is compared to the California state value.
US Value
(26.7)
The regional value is compared to the national value.
Trend
This comparison measures the indicator’s values over multiple time periods.<br>The Mann-Kendall Test for Statistical Significance is used to evaluate the trend<br>over 4 to 10 periods of measure, subject to data availability and comparability.
Workers Commuting by Public Transportation Region: Mid-County
Workers Commuting by Public Transportation Region: Mid-County
1.0%
(2018-2022)
Compared to:


CA Counties
The distribution is based on data from 58 California counties.
U.S. Counties
(2015-2019)
The distribution is based on data from 3,142 U.S. counties and county equivalents.
Santa Cruz, CA County Value
(1.8%)
The regional value is compared to the Santa Cruz County value.
CA Value
(3.6%)
The regional value is compared to the California state value.
US Value
(3.8%)
The regional value is compared to the national value.
Trend
This comparison measures the indicator’s values over multiple time periods.<br>The Mann-Kendall Test for Statistical Significance is used to evaluate the trend<br>over 4 to 10 periods of measure, subject to data availability and comparability.
HP 2030 Target
(5.3%)
Workers Commuting by Public Transportation Region: North County
Workers Commuting by Public Transportation Region: North County
2.9%
(2018-2022)
Compared to:
CA Counties
The distribution is based on data from 58 California counties.
U.S. Counties
(2015-2019)
The distribution is based on data from 3,142 U.S. counties and county equivalents.
Santa Cruz, CA County Value
(1.8%)
The regional value is compared to the Santa Cruz County value.
CA Value
(3.6%)
The regional value is compared to the California state value.
US Value
(3.8%)
The regional value is compared to the national value.
Trend
This comparison measures the indicator’s values over multiple time periods.<br>The Mann-Kendall Test for Statistical Significance is used to evaluate the trend<br>over 4 to 10 periods of measure, subject to data availability and comparability.
HP 2030 Target
(5.3%)
Workers Commuting by Public Transportation Region: San Lorenzo Valley
Workers Commuting by Public Transportation Region: San Lorenzo Valley
1.1%
(2018-2022)
Compared to:

CA Counties
The distribution is based on data from 58 California counties.
U.S. Counties
(2015-2019)
The distribution is based on data from 3,142 U.S. counties and county equivalents.
Santa Cruz, CA County Value
(1.8%)
The regional value is compared to the Santa Cruz County value.
CA Value
(3.6%)
The regional value is compared to the California state value.
US Value
(3.8%)
The regional value is compared to the national value.
Trend
This comparison measures the indicator’s values over multiple time periods.<br>The Mann-Kendall Test for Statistical Significance is used to evaluate the trend<br>over 4 to 10 periods of measure, subject to data availability and comparability.
HP 2030 Target
(5.3%)
Workers Commuting by Public Transportation Region: South County
Workers Commuting by Public Transportation Region: South County
0.8%
(2018-2022)
Compared to:

CA Counties
The distribution is based on data from 58 California counties.
U.S. Counties
(2015-2019)
The distribution is based on data from 3,142 U.S. counties and county equivalents.
Santa Cruz, CA County Value
(1.8%)
The regional value is compared to the Santa Cruz County value.
CA Value
(3.6%)
The regional value is compared to the California state value.
US Value
(3.8%)
The regional value is compared to the national value.
Trend
This comparison measures the indicator’s values over multiple time periods.<br>The Mann-Kendall Test for Statistical Significance is used to evaluate the trend<br>over 4 to 10 periods of measure, subject to data availability and comparability.
HP 2030 Target
(5.3%)
Workers who Drive Alone to Work Region: Mid-County
Workers who Drive Alone to Work Region: Mid-County
64.9%
(2018-2022)
Compared to:
CA Counties
The distribution is based on data from 58 California counties.
U.S. Counties
The distribution is based on data from 3,133 U.S. counties and county equivalents.
Santa Cruz, CA County Value
(64.2%)
The regional value is compared to the Santa Cruz County value.
CA Value
(68.4%)
The regional value is compared to the California state value.
US Value
(71.7%)
The regional value is compared to the national value.
Trend
This comparison measures the indicator’s values over multiple time periods.<br>The Mann-Kendall Test for Statistical Significance is used to evaluate the trend<br>over 4 to 10 periods of measure, subject to data availability and comparability.
Workers who Drive Alone to Work Region: North County
Workers who Drive Alone to Work Region: North County
59.2%
(2018-2022)
Compared to:
CA Counties
The distribution is based on data from 58 California counties.
U.S. Counties
The distribution is based on data from 3,133 U.S. counties and county equivalents.
Santa Cruz, CA County Value
(64.2%)
The regional value is compared to the Santa Cruz County value.
CA Value
(68.4%)
The regional value is compared to the California state value.
US Value
(71.7%)
The regional value is compared to the national value.
Trend
This comparison measures the indicator’s values over multiple time periods.<br>The Mann-Kendall Test for Statistical Significance is used to evaluate the trend<br>over 4 to 10 periods of measure, subject to data availability and comparability.
Workers who Drive Alone to Work Region: San Lorenzo Valley
Workers who Drive Alone to Work Region: San Lorenzo Valley
68.9%
(2018-2022)
Compared to:
CA Counties
The distribution is based on data from 58 California counties.
U.S. Counties
The distribution is based on data from 3,133 U.S. counties and county equivalents.
Santa Cruz, CA County Value
(64.2%)
The regional value is compared to the Santa Cruz County value.
CA Value
(68.4%)
The regional value is compared to the California state value.
US Value
(71.7%)
The regional value is compared to the national value.
Trend
This comparison measures the indicator’s values over multiple time periods.<br>The Mann-Kendall Test for Statistical Significance is used to evaluate the trend<br>over 4 to 10 periods of measure, subject to data availability and comparability.
Workers who Drive Alone to Work Region: South County
Workers who Drive Alone to Work Region: South County
70.7%
(2018-2022)
Compared to:
CA Counties
The distribution is based on data from 58 California counties.
U.S. Counties
The distribution is based on data from 3,133 U.S. counties and county equivalents.
Santa Cruz, CA County Value
(64.2%)
The regional value is compared to the Santa Cruz County value.
CA Value
(68.4%)
The regional value is compared to the California state value.
US Value
(71.7%)
The regional value is compared to the national value.
Trend
This comparison measures the indicator’s values over multiple time periods.<br>The Mann-Kendall Test for Statistical Significance is used to evaluate the trend<br>over 4 to 10 periods of measure, subject to data availability and comparability.
Workers who Walk to Work Region: Mid-County
Workers who Walk to Work Region: Mid-County
3.3%
(2018-2022)
Compared to:
CA Counties
The distribution is based on data from 58 California counties.
U.S. Counties
The distribution is based on data from 3,133 U.S. counties and county equivalents.
Santa Cruz, CA County Value
(4.6%)
The regional value is compared to the Santa Cruz County value.
CA Value
(2.4%)
The regional value is compared to the California state value.
US Value
(2.4%)
The regional value is compared to the national value.
Trend
This comparison measures the indicator’s values over multiple time periods.<br>The Mann-Kendall Test for Statistical Significance is used to evaluate the trend<br>over 4 to 10 periods of measure, subject to data availability and comparability.
Workers who Walk to Work Region: North County
Workers who Walk to Work Region: North County
7.3%
(2018-2022)
Compared to:
CA Counties
The distribution is based on data from 58 California counties.
U.S. Counties
The distribution is based on data from 3,133 U.S. counties and county equivalents.
Santa Cruz, CA County Value
(4.6%)
The regional value is compared to the Santa Cruz County value.
CA Value
(2.4%)
The regional value is compared to the California state value.
US Value
(2.4%)
The regional value is compared to the national value.
Trend
This comparison measures the indicator’s values over multiple time periods.<br>The Mann-Kendall Test for Statistical Significance is used to evaluate the trend<br>over 4 to 10 periods of measure, subject to data availability and comparability.
Workers who Walk to Work Region: San Lorenzo Valley
Workers who Walk to Work Region: San Lorenzo Valley
1.3%
(2018-2022)
Compared to:
CA Counties
The distribution is based on data from 58 California counties.
U.S. Counties
The distribution is based on data from 3,133 U.S. counties and county equivalents.
Santa Cruz, CA County Value
(4.6%)
The regional value is compared to the Santa Cruz County value.
CA Value
(2.4%)
The regional value is compared to the California state value.
US Value
(2.4%)
The regional value is compared to the national value.
Trend
This comparison measures the indicator’s values over multiple time periods.<br>The Mann-Kendall Test for Statistical Significance is used to evaluate the trend<br>over 4 to 10 periods of measure, subject to data availability and comparability.
Workers who Walk to Work Region: South County
Workers who Walk to Work Region: South County
1.9%
(2018-2022)
Compared to:
CA Counties
The distribution is based on data from 58 California counties.
U.S. Counties
The distribution is based on data from 3,133 U.S. counties and county equivalents.
Santa Cruz, CA County Value
(4.6%)
The regional value is compared to the Santa Cruz County value.
CA Value
(2.4%)
The regional value is compared to the California state value.
US Value
(2.4%)
The regional value is compared to the national value.
Trend
This comparison measures the indicator’s values over multiple time periods.<br>The Mann-Kendall Test for Statistical Significance is used to evaluate the trend<br>over 4 to 10 periods of measure, subject to data availability and comparability.
