Search for Indicators

Environmental Conservation
Environmental conservation focuses on preserving and protecting the natural environment, including air, waterways, and land. Look below for local strategies and data tracking progress on conservation efforts in Santa Cruz County.
- Quality of the Natural Environment and Natural Resources*- Concern for our environment has been increasing while our stewardship of water and local wildlife awareness has been decreasing.
- Climate Change Resiliency* - Water and natural gas usage continue to increase while residential electricity usage has not changed significantly.
- Safe, Affordable, Accessible Transportation System* - Travel time to work has increased but we have seen a significant increase in bikeway miles and workers commuting by public transportation.
*These snapshots are adapted from the CORE Results Menu on DataShare. Many desired indicators in the above impact areas are still unavailable at this time. Do you have a lead for adding to this data? Contact us! datasharescc@gmail.com
Focus On
Learn More
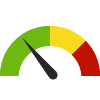
Concern for the Environment
Concern for the environment is an important indicator because many aspects of the community's health, wellbeing, and livelihood depend on the quality of the natural environment.
County: Santa Cruz
(Compared to Prior Value)
Focus On
Learn More
Weather and Climate
Droughts can reduce air quality and compromise the health of people with certain conditions, such as asthma, by increasing the amount of airborne particles, such as pollen and smoke. Droughts, combined with extreme heat, increase the risk of wildfires, threatening lives, houses, and agriculture.
This report provides a valuation of the natural capital in Santa Cruz County. The findings include a valuation of the benefits that natural capital provides to community members, and the return on investment of protecting the natural capital.
Learn More
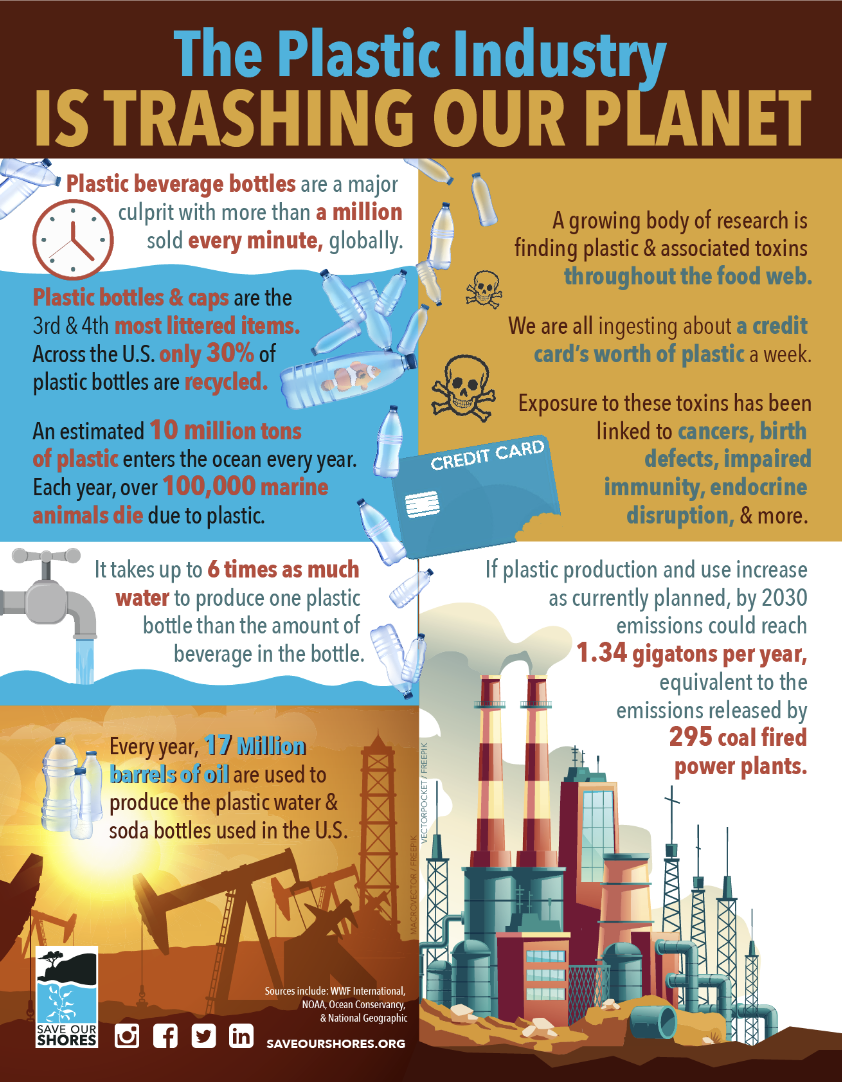
This infographic provides quick facts about the affect of plastic on our ocean, drinking water, and health.
Learn More

This report details the work Ecology Action is doing to decrease carbon emissions, educate residents, and increase access to electronic vehicle chargers.
Learn More
Save Our Shores Advocacy
Save Our Shores is deeply engaged in advocacy work to protect and preserve our natural resources. Their areas include prohibiting the construction of equipment for offshore drilling and obtaining National Marine Sanctuary status for Monterey Bay.
County Strategic Plan
A sustainable environment is one aspect of the County Strategic Plan. The 2021-2023 Operational Goals include additional protection and restoration efforts for natural resources and strengthening environmental conservation.
Ecology Action Community Engagement
Ecology Action works with the community to increase energy and water efficiency. They also host programs to help community members ride bikes and assist businesses, organizations, and residents switch to electric energy.
Indicator Gauge Icon Legend
Legend Colors
Red is bad, green is good, blue is not statistically different/neutral.
Compared to Distribution
 the value is in the best half of communities.
 the value is in the 2nd worst quarter of communities.
 the value is in the worst quarter of communities.
Compared to Target
 meets target;
  does not meet target.
Compared to a Single Value
 lower than the comparison value;
 higher than the comparison value;
 not statistically different from comparison value.
Trend

 non-significant change over time;
 significant change over time;
  no change over time.
Compared to Prior Value
 higher than the previous measurement period;
 lower than the previous measurement period;
 no statistically different change from previous measurement period.
Environmental Health / Air
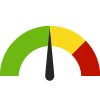
Annual Ozone Air Quality County: Santa Cruz
Annual Ozone Air Quality County: Santa Cruz
1
(2019-2021)
Compared to:
Air Quality Index
The American Lung Association (ALA) assigns grades A-F to counties (A=1; B=2; C=3; D=4; F=5), based on average annual number of days that ozone levels exceeded U.S. standards during the three year measurement period. The five-point grading scale was used for the distribution (Green = <2; Yellow = 2 - 3; Red = >3). The air quality data is collected by the EPA and summarized by the ALA.
Prior Value
(1)
Prior Value compares a measured value with the previously measured value. Confidence intervals were not taken into account in determining the direction of the comparison.
Trend
This comparison measures the indicator’s values over multiple time periods.<br>The Mann-Kendall Test for Statistical Significance is used to evaluate the trend<br>over 4 to 10 periods of measure, subject to data availability and comparability.
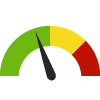
Annual Particle Pollution County: Santa Cruz
Annual Particle Pollution County: Santa Cruz
5
(2019-2021)
Compared to:

Air Quality Index
The American Lung Association (ALA) assigns grades A-F to counties (A=1; B=2; C=3; D=4; F=5), based on average annual number of days that particle pollution levels exceeded U.S. standards during the three year measurement period. The five-point grading scale was used for the distribution (Green = <2; Yellow = 2 - 3; Red = >3). The air quality data is collected by the EPA and summarized by the ALA.
Prior Value
(5)
Prior Value compares a measured value with the previously measured value. Confidence intervals were not taken into account in determining the direction of the comparison.
Trend
This comparison measures the indicator’s values over multiple time periods.<br>The Mann-Kendall Test for Statistical Significance is used to evaluate the trend<br>over 4 to 10 periods of measure, subject to data availability and comparability.
High Ozone Days County: Santa Cruz
High Ozone Days County: Santa Cruz
0.0
Days
(2019-2021)
Compared to:
Prior Value
(0.0)
Prior Value compares a measured value with the previously measured value. Confidence intervals were not taken into account in determining the direction of the comparison.
Trend
This comparison measures the indicator’s values over multiple time periods.<br>The Mann-Kendall Test for Statistical Significance is used to evaluate the trend<br>over 4 to 10 periods of measure, subject to data availability and comparability.
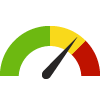
High Particle Days County: Santa Cruz
High Particle Days County: Santa Cruz
10.0
Days
(2019-2021)
Compared to:

Prior Value
(14.2)
Prior Value compares a measured value with the previously measured value. Confidence intervals were not taken into account in determining the direction of the comparison.
Trend
This comparison measures the indicator’s values over multiple time periods.<br>The Mann-Kendall Test for Statistical Significance is used to evaluate the trend<br>over 4 to 10 periods of measure, subject to data availability and comparability.
Recognized Carcinogens Released into Air County: Santa Cruz
Recognized Carcinogens Released into Air County: Santa Cruz
0
Pounds
(2022)
Compared to:
Prior Value
Prior Value compares a measured value with the previously measured value. Confidence intervals were not taken into account in determining the direction of the comparison.
Environmental Health / Built Environment
Access to Exercise Opportunities County: Santa Cruz
Access to Exercise Opportunities County: Santa Cruz
97.7%
(2024)
Compared to:
CA Counties
The distribution is based on data from 58 California counties.
U.S. Counties
The distribution is based on data from 3,096 U.S. counties and county equivalents.
CA Value
(94.2%)
The regional value is compared to the California state value.
US Value
(84.1%)
The regional value is compared to the national value.
Prior Value
(96.8%)
Prior Value compares a measured value with the previously measured value. Confidence intervals were not taken into account in determining the direction of the comparison.
Access to Parks County: Santa Cruz
Access to Parks County: Santa Cruz
85.8%
(2020)
Compared to:
CA Counties
The distribution is based on data from 58 California counties.
CA Value
(82.4%)
The regional value is compared to the California state value.
Prior Value
(84.7%)
Prior Value compares a measured value with the previously measured value. Confidence intervals were not taken into account in determining the direction of the comparison.
Adult Arrest Rate County: Santa Cruz
Adult Arrest Rate County: Santa Cruz
38.7
Arrests per 1,000 population 18+
(2022)
Compared to:


CA Counties
The distribution is based on data from 58 California counties.
CA Value
(25.1)
The regional value is compared to the California state value.
Prior Value
(38.1)
Prior Value compares a measured value with the previously measured value. Confidence intervals were not taken into account in determining the direction of the comparison.
Trend
This comparison measures the indicator’s values over multiple time periods.<br>The Mann-Kendall Test for Statistical Significance is used to evaluate the trend<br>over 4 to 10 periods of measure, subject to data availability and comparability.
Bikeway Miles County: Santa Cruz
Bikeway Miles County: Santa Cruz
229
Miles
(2022)
Compared to:
Prior Value
(227)
Prior Value compares a measured value with the previously measured value. Confidence intervals were not taken into account in determining the direction of the comparison.
Trend
This comparison measures the indicator’s values over multiple time periods.<br>The Mann-Kendall Test for Statistical Significance is used to evaluate the trend<br>over 4 to 10 periods of measure, subject to data availability and comparability.
Environmental Health / Built Environment
Children with Low Access to a Grocery Store
Value
Compared to:
Children with Low Access to a Grocery Store County: Santa Cruz
Children with Low Access to a Grocery Store County: Santa Cruz
2.5%
(2015)
Compared to:
CA Counties
The distribution is based on data from 58 California counties.
U.S. Counties
The distribution is based on data from 3,123 U.S. counties and county equivalents.
Prior Value
(2.9%)
Prior Value compares a measured value with the previously measured value. Confidence intervals were not taken into account in determining the direction of the comparison.
Community Spending on Transportation County: Santa Cruz
Community Spending on Transportation County: Santa Cruz
15.0%
(2023)
Compared to:

CA Value
(15.7%)
The regional value is compared to the California state value.
US Value
(17.4%)
The regional value is compared to the national value.
Prior Value
(15.0%)
Prior Value compares a measured value with the previously measured value. Confidence intervals were not taken into account in determining the direction of the comparison.
Farmers Market Density County: Santa Cruz
Farmers Market Density County: Santa Cruz
0.04
Markets per 1,000 population
(2018)
Compared to:
US Value
(0.03 in 2016)
The regional value is compared to the median value of 3,143 U.S. counties and county equivalents.
Prior Value
(0.04)
Prior Value compares a measured value with the previously measured value. Confidence intervals were not taken into account in determining the direction of the comparison.
Trend
This comparison measures the indicator’s values over multiple time periods.<br>The Mann-Kendall Test for Statistical Significance is used to evaluate the trend<br>over 4 to 10 periods of measure, subject to data availability and comparability.
Fast Food Restaurant Density County: Santa Cruz
Fast Food Restaurant Density County: Santa Cruz
0.64
Restaurants per 1,000 population
(2016)
Compared to:
CA Counties
The distribution is based on data from 58 California counties.
U.S. Counties
The distribution is based on data from 3,143 U.S. counties and county equivalents.
Prior Value
(0.65)
Prior Value compares a measured value with the previously measured value. Confidence intervals were not taken into account in determining the direction of the comparison.
Trend
This comparison measures the indicator’s values over multiple time periods.<br>The Mann-Kendall Test for Statistical Significance is used to evaluate the trend<br>over 4 to 10 periods of measure, subject to data availability and comparability.
Food Environment Index County: Santa Cruz
Food Environment Index County: Santa Cruz
8.4
(2024)
Compared to:

CA Counties
The distribution is based on data from 58 California counties.
U.S. Counties
The distribution is based on data from 3,108 U.S. counties and county equivalents.
CA Value
(8.6)
The regional value is compared to the California state value.
US Value
(7.7)
The regional value is compared to the national value.
Prior Value
(8.2)
Prior Value compares a measured value with the previously measured value. Confidence intervals were not taken into account in determining the direction of the comparison.
Trend
This comparison measures the indicator’s values over multiple time periods.<br>The Mann-Kendall Test for Statistical Significance is used to evaluate the trend<br>over 4 to 10 periods of measure, subject to data availability and comparability.
Grocery Store Density County: Santa Cruz
Grocery Store Density County: Santa Cruz
0.26
Stores per 1,000 population
(2016)
Compared to:

CA Counties
The distribution is based on data from 58 California counties.
U.S. Counties
The distribution is based on data from 3,143 U.S. counties and county equivalents.
Prior Value
(0.26)
Prior Value compares a measured value with the previously measured value. Confidence intervals were not taken into account in determining the direction of the comparison.
Trend
This comparison measures the indicator’s values over multiple time periods.<br>The Mann-Kendall Test for Statistical Significance is used to evaluate the trend<br>over 4 to 10 periods of measure, subject to data availability and comparability.
Environmental Health / Built Environment
Households with No Car and Low Access to a Grocery Store
Value
Compared to:
Households with No Car and Low Access to a Grocery Store County: Santa Cruz
Households with No Car and Low Access to a Grocery Store County: Santa Cruz
0.9%
(2015)
Compared to:
CA Counties
The distribution is based on data from 58 California counties.
U.S. Counties
The distribution is based on data from 3,140 U.S. counties and county equivalents.
Prior Value
(0.9%)
Prior Value compares a measured value with the previously measured value. Confidence intervals were not taken into account in determining the direction of the comparison.
Liquor Store Density County: Santa Cruz
Liquor Store Density County: Santa Cruz
14.9
Stores per 100,000 population
(2021)
Compared to:
CA Counties
The distribution is based on data from 44 California counties.
U.S. Counties
The distribution is based on data from 1,477 U.S. counties and county equivalents.
CA Value
(11.0)
The regional value is compared to the California state value.
US Value
(10.7)
The regional value is compared to the national value.
Prior Value
(15.2)
Prior Value compares a measured value with the previously measured value. Confidence intervals were not taken into account in determining the direction of the comparison.
Trend
This comparison measures the indicator’s values over multiple time periods.<br>The Mann-Kendall Test for Statistical Significance is used to evaluate the trend<br>over 4 to 10 periods of measure, subject to data availability and comparability.
Environmental Health / Built Environment
Low-Income and Low Access to a Grocery Store
Value
Compared to:
Low-Income and Low Access to a Grocery Store County: Santa Cruz
Low-Income and Low Access to a Grocery Store County: Santa Cruz
3.8%
(2015)
Compared to:
CA Counties
The distribution is based on data from 58 California counties.
U.S. Counties
The distribution is based on data from 3,123 U.S. counties and county equivalents.
Prior Value
(4.0%)
Prior Value compares a measured value with the previously measured value. Confidence intervals were not taken into account in determining the direction of the comparison.
Overcrowded Households County: Santa Cruz
Overcrowded Households County: Santa Cruz
6.8%
(2018-2022)
Compared to:
CA Counties
The distribution is based on data from 58 California counties.
CA Value
(8.2%)
The regional value is compared to the California state value.
US Value
(3.4%)
The regional value is compared to the national value.
Trend
This comparison measures the indicator’s values over multiple time periods.<br>The Mann-Kendall Test for Statistical Significance is used to evaluate the trend<br>over 4 to 10 periods of measure, subject to data availability and comparability.
Environmental Health / Built Environment
People 65+ with Low Access to a Grocery Store
Value
Compared to:
People 65+ with Low Access to a Grocery Store County: Santa Cruz
People 65+ with Low Access to a Grocery Store County: Santa Cruz
1.5%
(2015)
Compared to:
CA Counties
The distribution is based on data from 58 California counties.
U.S. Counties
The distribution is based on data from 3,123 U.S. counties and county equivalents.
Prior Value
(1.9%)
Prior Value compares a measured value with the previously measured value. Confidence intervals were not taken into account in determining the direction of the comparison.
Proximity to Highways County: Santa Cruz
Proximity to Highways County: Santa Cruz
0.0%
(2020)
Compared to:
CA Counties
The distribution is based on data from 58 California counties.
CA Value
(6.6%)
The regional value is compared to the California state value.
Prior Value
(0.0%)
Prior Value compares a measured value with the previously measured value. Confidence intervals were not taken into account in determining the direction of the comparison.
Recreation and Fitness Facilities County: Santa Cruz
Recreation and Fitness Facilities County: Santa Cruz
0.13
Facilities per 1,000 population
(2016)
Compared to:

US Value
(0.06 in 2014)
The regional value is compared to the median value of 3,143 U.S. counties and county equivalents.
Prior Value
(0.14)
Prior Value compares a measured value with the previously measured value. Confidence intervals were not taken into account in determining the direction of the comparison.
Trend
This comparison measures the indicator’s values over multiple time periods.<br>The Mann-Kendall Test for Statistical Significance is used to evaluate the trend<br>over 4 to 10 periods of measure, subject to data availability and comparability.
Severe Housing Problems County: Santa Cruz
Severe Housing Problems County: Santa Cruz
25.6%
(2016-2020)
Compared to:
CA Counties
The distribution is based on data from 58 California counties.
U.S. Counties
The distribution is based on data from 3,141 U.S. counties and county equivalents.
CA Value
(25.7%)
The regional value is compared to the California state value.
US Value
(16.7%)
The regional value is compared to the national value.
Prior Value
(26.5%)
Prior Value compares a measured value with the previously measured value. Confidence intervals were taken into account in determining the direction of the comparison.
Trend
This comparison measures the indicator’s values over multiple time periods.<br>The Mann-Kendall Test for Statistical Significance is used to evaluate the trend<br>over 4 to 10 periods of measure, subject to data availability and comparability.
WIC Certified Stores County: Santa Cruz
WIC Certified Stores County: Santa Cruz
0.1
Stores per 1,000 population
(2016)
Compared to:
CA Counties
The distribution is based on data from 57 California counties.
U.S. Counties
The distribution is based on data from 2,981 U.S. counties and county equivalents.
Environmental Health / Energy & Sustainability
Environmental Health / Energy & Sustainability
Gasoline and Other Fuels Spending-to-Income Ratio
Value
Compared to:
Gasoline and Other Fuels Spending-to-Income Ratio County: Santa Cruz
Gasoline and Other Fuels Spending-to-Income Ratio County: Santa Cruz
2.7%
(2023)
Compared to:
CA Counties
The distribution is based on data from 58 California counties.
U.S. Counties
The distribution is based on data from 3,141 U.S. counties and county equivalents.
CA Value
(3.0%)
The regional value is compared to the California state value.
Prior Value
(2.7%)
Prior Value compares a measured value with the previously measured value. Confidence intervals were not taken into account in determining the direction of the comparison.
Residential Electricity Use County: Santa Cruz
Residential Electricity Use County: Santa Cruz
2,013.8
KWh
(2022)
Compared to:
CA Counties
The distribution is based on data from 58 California counties.
Prior Value
(2,121.4)
Prior Value compares a measured value with the previously measured value. Confidence intervals were not taken into account in determining the direction of the comparison.
Trend
This comparison measures the indicator’s values over multiple time periods.<br>The Mann-Kendall Test for Statistical Significance is used to evaluate the trend<br>over 4 to 10 periods of measure, subject to data availability and comparability.
Residential Natural Gas Use County: Santa Cruz
Residential Natural Gas Use County: Santa Cruz
116.1
Therms
(2022)
Compared to:

CA Counties
The distribution is based on data from 50 California counties.
Prior Value
(121.2)
Prior Value compares a measured value with the previously measured value. Confidence intervals were not taken into account in determining the direction of the comparison.
Trend
This comparison measures the indicator’s values over multiple time periods.<br>The Mann-Kendall Test for Statistical Significance is used to evaluate the trend<br>over 4 to 10 periods of measure, subject to data availability and comparability.
Environmental Health / Energy & Sustainability
Utilities Spending-to-Income Ratio
Value
Compared to:
Utilities Spending-to-Income Ratio County: Santa Cruz
Utilities Spending-to-Income Ratio County: Santa Cruz
4.1%
(2023)
Compared to:
CA Counties
The distribution is based on data from 58 California counties.
U.S. Counties
The distribution is based on data from 3,141 U.S. counties and county equivalents.
CA Value
(4.7%)
The regional value is compared to the California state value.
Prior Value
(4.0%)
Prior Value compares a measured value with the previously measured value. Confidence intervals were not taken into account in determining the direction of the comparison.
Environmental Health / Environmental Justice
Pounds of Recycling County: Santa Cruz
Pounds of Recycling County: Santa Cruz
781
Pounds
(2023)
Compared to:
Prior Value
(662)
Prior Value compares a measured value with the previously measured value. Confidence intervals were not taken into account in determining the direction of the comparison.
Trend
This comparison measures the indicator’s values over multiple time periods.<br>The Mann-Kendall Test for Statistical Significance is used to evaluate the trend<br>over 4 to 10 periods of measure, subject to data availability and comparability.
Pounds of Trash County: Santa Cruz
Pounds of Trash County: Santa Cruz
34,741
Pounds
(2023)
Compared to:
Prior Value
(11,704)
Prior Value compares a measured value with the previously measured value. Confidence intervals were not taken into account in determining the direction of the comparison.
Trend
This comparison measures the indicator’s values over multiple time periods.<br>The Mann-Kendall Test for Statistical Significance is used to evaluate the trend<br>over 4 to 10 periods of measure, subject to data availability and comparability.
Environmental Health / Toxins & Contaminants
Adults with Asthma County: Santa Cruz
Adults with Asthma County: Santa Cruz
17.7%
(2022)
Compared to:
CA Counties
The distribution is based on data from 58 California counties.
CA Value
(17.0%)
The regional value is compared to the California state value.
US Value
(15.7%)
The regional value is compared to the national value. The source for the national value is Behavioral Risk Factor Surveillance System
Prior Value
(17.2%)
Prior Value compares a measured value with the previously measured value. Confidence intervals were taken into account in determining the direction of the comparison.
Trend
This comparison measures the indicator’s values over multiple time periods.<br>The Mann-Kendall Test for Statistical Significance is used to evaluate the trend<br>over 4 to 10 periods of measure, subject to data availability and comparability.
Adults with Current Asthma County: Santa Cruz
Adults with Current Asthma County: Santa Cruz
9.5%
(2021)
Compared to:
CA Counties
The distribution is based on data from 58 California counties.
U.S. Counties
The distribution is based on data from 3,074 U.S. counties and county equivalents.
US Value
(9.7%)
The regional value is compared to the national value.
Asthma: Medicare Population County: Santa Cruz
Asthma: Medicare Population County: Santa Cruz
7.0%
(2022)
Compared to:
CA Counties
The distribution is based on data from 58 California counties.
U.S. Counties
The distribution is based on data from 3,129 U.S. counties and county equivalents.
CA Value
(7.0%)
The regional value is compared to the California state value.
US Value
(7.0%)
The regional value is compared to the national value.
Prior Value
(7.0%)
Prior Value compares a measured value with the previously measured value. Confidence intervals were not taken into account in determining the direction of the comparison.
Trend
This comparison measures the indicator’s values over multiple time periods.<br>The Mann-Kendall Test for Statistical Significance is used to evaluate the trend<br>over 4 to 10 periods of measure, subject to data availability and comparability.
Environmental Health / Toxins & Contaminants
Concern for the Enviornment: Water Pollution
Value
Compared to:
Concern for the Enviornment: Water Pollution County: Santa Cruz
Concern for the Enviornment: Water Pollution County: Santa Cruz
22.5%
Percent (%)
(2019)
Compared to:
Prior Value
(21.6%)
Prior Value compares a measured value with the previously measured value. Confidence intervals were not taken into account in determining the direction of the comparison.
Concern for the Environment: Litter County: Santa Cruz
Concern for the Environment: Litter County: Santa Cruz
23.7%
Percent (%)
(2019)
Compared to:
Prior Value
(15.5%)
Prior Value compares a measured value with the previously measured value. Confidence intervals were not taken into account in determining the direction of the comparison.
Environmental Health / Toxins & Contaminants
Concern for the Environment: Water Availability/Saltwater Intrusion
Value
Compared to:
Concern for the Environment: Water Availability/Saltwater Intrusion County: Santa Cruz
Concern for the Environment: Water Availability/Saltwater Intrusion County: Santa Cruz
14.3%
Percent (%)
(2019)
Compared to:
Prior Value
(19.5%)
Prior Value compares a measured value with the previously measured value. Confidence intervals were not taken into account in determining the direction of the comparison.
Environmental Health / Toxins & Contaminants
Health of County Beaches - Swim Advisory Days
Value
Compared to:
Health of County Beaches - Swim Advisory Days County: Santa Cruz
Health of County Beaches - Swim Advisory Days County: Santa Cruz
194
Days
(2018)
Compared to:
Prior Value
(174)
Prior Value compares a measured value with the previously measured value. Confidence intervals were not taken into account in determining the direction of the comparison.
Trend
This comparison measures the indicator’s values over multiple time periods.<br>The Mann-Kendall Test for Statistical Significance is used to evaluate the trend<br>over 4 to 10 periods of measure, subject to data availability and comparability.
PBT Released County: Santa Cruz
PBT Released County: Santa Cruz
0
Pounds
(2022)
Compared to:
Prior Value
Prior Value compares a measured value with the previously measured value. Confidence intervals were not taken into account in determining the direction of the comparison.
Environmental Health / Toxins & Contaminants
Residents that Installed Higher Efficiency Water Fixture Inside Their Home
Value
Compared to:
Residents that Installed Higher Efficiency Water Fixture Inside Their Home County: Santa Cruz
Residents that Installed Higher Efficiency Water Fixture Inside Their Home County: Santa Cruz
58.2%
Percent (%)
(2019)
Compared to:
Prior Value
(58.1%)
Prior Value compares a measured value with the previously measured value. Confidence intervals were not taken into account in determining the direction of the comparison.
Environmental Health / Toxins & Contaminants
Residents who Attended a Cleanup Event, Habitat Restoration, or Active Volunteer Day
Value
Compared to:
Residents who Attended a Cleanup Event, Habitat Restoration, or Active Volunteer Day County: Santa Cruz
Residents who Attended a Cleanup Event, Habitat Restoration, or Active Volunteer Day County: Santa Cruz
30.8%
Percent (%)
(2019)
Compared to:
Prior Value
(29.9%)
Prior Value compares a measured value with the previously measured value. Confidence intervals were not taken into account in determining the direction of the comparison.
Environmental Health / Toxins & Contaminants
Residents Who Have Reduced Storm Water and Irrigation Run-off From Their Yard
Value
Compared to:
Residents Who Have Reduced Storm Water and Irrigation Run-off From Their Yard County: Santa Cruz
Residents Who Have Reduced Storm Water and Irrigation Run-off From Their Yard County: Santa Cruz
50.4%
Percent (%)
(2019)
Compared to:
Prior Value
(57.7%)
Prior Value compares a measured value with the previously measured value. Confidence intervals were not taken into account in determining the direction of the comparison.
Environmental Health / Toxins & Contaminants
Residents who Installed a Rainwater Harvesting System
Value
Compared to:
Residents who Installed a Rainwater Harvesting System County: Santa Cruz
Residents who Installed a Rainwater Harvesting System County: Santa Cruz
17.2%
Percent (%)
(2019)
Compared to:
Prior Value
(17.8%)
Prior Value compares a measured value with the previously measured value. Confidence intervals were not taken into account in determining the direction of the comparison.
Environmental Health / Weather & Climate
Number of Extreme Heat Days County: Santa Cruz
Number of Extreme Heat Days County: Santa Cruz
27
Days
(2021)
Compared to:
Prior Value
(25)
Prior Value compares a measured value with the previously measured value. Confidence intervals were not taken into account in determining the direction of the comparison.
Trend
This comparison measures the indicator’s values over multiple time periods.<br>The Mann-Kendall Test for Statistical Significance is used to evaluate the trend<br>over 4 to 10 periods of measure, subject to data availability and comparability.
Number of Extreme Heat Events County: Santa Cruz
Number of Extreme Heat Events County: Santa Cruz
23
Events
(2021)
Compared to:
Prior Value
(20)
Prior Value compares a measured value with the previously measured value. Confidence intervals were not taken into account in determining the direction of the comparison.
Trend
This comparison measures the indicator’s values over multiple time periods.<br>The Mann-Kendall Test for Statistical Significance is used to evaluate the trend<br>over 4 to 10 periods of measure, subject to data availability and comparability.
Number of Extreme Precipitation Days County: Santa Cruz
Number of Extreme Precipitation Days County: Santa Cruz
7
Days
(2021)
Compared to:
Prior Value
(4)
Prior Value compares a measured value with the previously measured value. Confidence intervals were not taken into account in determining the direction of the comparison.
Trend
This comparison measures the indicator’s values over multiple time periods.<br>The Mann-Kendall Test for Statistical Significance is used to evaluate the trend<br>over 4 to 10 periods of measure, subject to data availability and comparability.
Weeks of Moderate Drought or Worse County: Santa Cruz
Weeks of Moderate Drought or Worse County: Santa Cruz
38
Weeks per year
(2021)
Compared to:
Prior Value
(24)
Prior Value compares a measured value with the previously measured value. Confidence intervals were not taken into account in determining the direction of the comparison.
Trend
This comparison measures the indicator’s values over multiple time periods.<br>The Mann-Kendall Test for Statistical Significance is used to evaluate the trend<br>over 4 to 10 periods of measure, subject to data availability and comparability.
Environmental Health / Wildlife
Environmental Health / Wildlife
Residents that Learned about Local Wildlife, Birds, or Fish to Protect Our Wildlife
Value
Compared to:
Residents that Learned about Local Wildlife, Birds, or Fish to Protect Our Wildlife County: Santa Cruz
Residents that Learned about Local Wildlife, Birds, or Fish to Protect Our Wildlife County: Santa Cruz
60.2%
Percent (%)
(2019)
Compared to:
Prior Value
(61.2%)
Prior Value compares a measured value with the previously measured value. Confidence intervals were not taken into account in determining the direction of the comparison.
