Search for Indicators
Mental Health in Santa Cruz County 2023
Mental health is a state of mental well-being that enables people to cope with the stresses of life, realize their abilities, learn well and work well, and contribute to their community. It is an integral component of health and well-being that underpins our individual and collective abilities to make decisions, build relationships and shape the world we live in. Mental health is a basic human right. And it is crucial to personal, community and socio-economic development.
Indicator Gauge Icon Legend
Legend Colors
Red is bad, green is good, blue is not statistically different/neutral.
Compared to Distribution
 the value is in the best half of communities.
 the value is in the 2nd worst quarter of communities.
 the value is in the worst quarter of communities.
Compared to Target
 meets target;
  does not meet target.
Compared to a Single Value
 lower than the comparison value;
 higher than the comparison value;
 not statistically different from comparison value.
Trend

 non-significant change over time;
 significant change over time;
  no change over time.
Compared to Prior Value
 higher than the previous measurement period;
 lower than the previous measurement period;
 no statistically different change from previous measurement period.
Health / Health Care Access & Quality
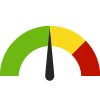
Adults who have had a Routine Checkup County: Santa Cruz
Adults who have had a Routine Checkup County: Santa Cruz
68.5%
(2022)
Compared to:

CA Counties
The distribution is based on data from 58 California counties.
CA Value
(67.0%)
The regional value is compared to the California state value.
Prior Value
(61.1%)
Prior Value compares a measured value with the previously measured value. Confidence intervals were taken into account in determining the direction of the comparison.
Trend
This comparison measures the indicator’s values over multiple time periods.<br>The Mann-Kendall Test for Statistical Significance is used to evaluate the trend<br>over 4 to 10 periods of measure, subject to data availability and comparability.
Community Spending on Health Care County: Santa Cruz
Community Spending on Health Care County: Santa Cruz
6.6%
(2023)
Compared to:


CA Value
(6.4%)
The regional value is compared to the California state value.
US Value
(8.0%)
The regional value is compared to the national value.
Prior Value
(6.6%)
Prior Value compares a measured value with the previously measured value. Confidence intervals were not taken into account in determining the direction of the comparison.
Health / Mental Health & Mental Disorders
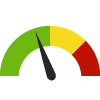
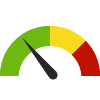
Adults Ever Diagnosed with Depression County: Santa Cruz
Adults Ever Diagnosed with Depression County: Santa Cruz
18.5%
(2021)
Compared to:
CA Counties
The distribution is based on data from 58 California counties.
US Value
(19.5%)
The regional value is compared to the national value.
Health / Mental Health & Mental Disorders
Adults Needing and Receiving Behavioral Health Care Services
Value
Compared to:
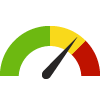
Adults Needing and Receiving Behavioral Health Care Services County: Santa Cruz
Adults Needing and Receiving Behavioral Health Care Services County: Santa Cruz
67.0%
(2021-2022)
Compared to:

CA Counties
The distribution is based on data from 58 California counties.
CA Value
(55.9%)
The regional value is compared to the California state value.
Prior Value
(58.0%)
Prior Value compares a measured value with the previously measured value. Confidence intervals were taken into account in determining the direction of the comparison.
Trend
This comparison measures the indicator’s values over multiple time periods.<br>The Mann-Kendall Test for Statistical Significance is used to evaluate the trend<br>over 4 to 10 periods of measure, subject to data availability and comparability.
Health / Mental Health & Mental Disorders
Adults Who Ever Thought Seriously About Committing Suicide
Value
Compared to:
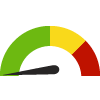
Adults Who Ever Thought Seriously About Committing Suicide County: Santa Cruz
Adults Who Ever Thought Seriously About Committing Suicide County: Santa Cruz
20.2%
(2021-2022)
Compared to:


CA Counties
The distribution is based on data from 58 California counties.
CA Value
(19.0%)
The regional value is compared to the California state value.
Prior Value
(22.1%)
Prior Value compares a measured value with the previously measured value. Confidence intervals were taken into account in determining the direction of the comparison.
Trend
This comparison measures the indicator’s values over multiple time periods.<br>The Mann-Kendall Test for Statistical Significance is used to evaluate the trend<br>over 4 to 10 periods of measure, subject to data availability and comparability.
Health / Mental Health & Mental Disorders
Adults with Likely Serious Psychological Distress
Value
Compared to:
Adults with Likely Serious Psychological Distress County: Santa Cruz
Adults with Likely Serious Psychological Distress County: Santa Cruz
17.9%
(2021-2022)
Compared to:
CA Counties
The distribution is based on data from 58 California counties.
CA Value
(16.7%)
The regional value is compared to the California state value.
Prior Value
(20.4%)
Prior Value compares a measured value with the previously measured value. Confidence intervals were taken into account in determining the direction of the comparison.
Trend
This comparison measures the indicator’s values over multiple time periods.<br>The Mann-Kendall Test for Statistical Significance is used to evaluate the trend<br>over 4 to 10 periods of measure, subject to data availability and comparability.
Age-Adjusted Death Rate due to Suicide County: Santa Cruz
Age-Adjusted Death Rate due to Suicide County: Santa Cruz
11.6
Deaths per 100,000 population
(2019-2021)
Compared to:
CA Counties
The distribution is based on data from 57 California counties.
CA Value
(10.3)
The regional value is compared to the California state value.
US Value
(13.5 in 2020)
The regional value is compared to the national value. The source for the national value is Centers for Disease Control and Prevention
Prior Value
(12.8)
Prior Value compares a measured value with the previously measured value. Confidence intervals were taken into account in determining the direction of the comparison.
Trend
This comparison measures the indicator’s values over multiple time periods.<br>The Mann-Kendall Test for Statistical Significance is used to evaluate the trend<br>over 4 to 10 periods of measure, subject to data availability and comparability.
Depression: Medicare Population County: Santa Cruz
Depression: Medicare Population County: Santa Cruz
14.0%
(2022)
Compared to:

CA Counties
The distribution is based on data from 58 California counties.
CA Value
(14.0%)
The regional value is compared to the California state value.
US Value
(16.0%)
The regional value is compared to the national value.
Prior Value
(14.0%)
Prior Value compares a measured value with the previously measured value. Confidence intervals were not taken into account in determining the direction of the comparison.
Trend
This comparison measures the indicator’s values over multiple time periods.<br>The Mann-Kendall Test for Statistical Significance is used to evaluate the trend<br>over 4 to 10 periods of measure, subject to data availability and comparability.
Health / Mental Health & Mental Disorders
Individuals Utilizing Behavioral Health Services at the County of Santa Cruz
Value
Compared to:
Individuals Utilizing Behavioral Health Services at the County of Santa Cruz County: Santa Cruz
Individuals Utilizing Behavioral Health Services at the County of Santa Cruz County: Santa Cruz
3,747
People
(2022-2023)
Compared to:


Prior Value
(3,448)
Prior Value compares a measured value with the previously measured value. Confidence intervals were not taken into account in determining the direction of the comparison.
Trend
This comparison measures the indicator’s values over multiple time periods.<br>The Mann-Kendall Test for Statistical Significance is used to evaluate the trend<br>over 4 to 10 periods of measure, subject to data availability and comparability.
Mental Health Provider Rate County: Santa Cruz
Mental Health Provider Rate County: Santa Cruz
951
Providers per 100,000 population
(2023)
Compared to:
CA Counties
The distribution is based on data from 58 California counties.
CA Value
(450)
The regional value is compared to the California state value.
Prior Value
(914)
Prior Value compares a measured value with the previously measured value. Confidence intervals were not taken into account in determining the direction of the comparison.
Trend
This comparison measures the indicator’s values over multiple time periods.<br>The Mann-Kendall Test for Statistical Significance is used to evaluate the trend<br>over 4 to 10 periods of measure, subject to data availability and comparability.
Poor Mental Health: 14+ Days County: Santa Cruz
Poor Mental Health: 14+ Days County: Santa Cruz
15.1%
(2021)
Compared to:
CA Counties
The distribution is based on data from 58 California counties.
US Value
(14.7%)
The regional value is compared to the national value.
Health / Mental Health & Mental Disorders
Poor Mental Health: Average Number of Days
Value
Compared to:
Poor Mental Health: Average Number of Days County: Santa Cruz
Poor Mental Health: Average Number of Days County: Santa Cruz
5.2
Days
(2021)
Compared to:
CA Counties
The distribution is based on data from 58 California counties.
CA Value
(4.7)
The regional value is compared to the California state value.
US Value
(4.8)
The regional value is compared to the national value.
Prior Value
(4.6)
Prior Value compares a measured value with the previously measured value. Confidence intervals were taken into account in determining the direction of the comparison.
Trend
This comparison measures the indicator’s values over multiple time periods.<br>The Mann-Kendall Test for Statistical Significance is used to evaluate the trend<br>over 4 to 10 periods of measure, subject to data availability and comparability.
Health / Wellness & Lifestyle
Poor Physical Health: 14+ Days County: Santa Cruz
Poor Physical Health: 14+ Days County: Santa Cruz
10.5%
(2021)
Compared to:
CA Counties
The distribution is based on data from 58 California counties.
US Value
(10.9%)
The regional value is compared to the national value.
Economy / Food Insecurity
Food Insecurity Rate County: Santa Cruz
Food Insecurity Rate County: Santa Cruz
9.0%
(2021)
Compared to:
CA Counties
The distribution is based on data from 58 California counties.
CA Value
(10.5%)
The regional value is compared to the California state value.
US Value
(10.4%)
The regional value is compared to the national value.
Prior Value
(10.0%)
Prior Value compares a measured value with the previously measured value. Confidence intervals were not taken into account in determining the direction of the comparison.
Trend
This comparison measures the indicator’s values over multiple time periods.<br>The Mann-Kendall Test for Statistical Significance is used to evaluate the trend<br>over 4 to 10 periods of measure, subject to data availability and comparability.
Economy / Poverty
Youth not in School or Working County: Santa Cruz
Youth not in School or Working County: Santa Cruz
0.5%
(2018-2022)
Compared to:
CA Counties
The distribution is based on data from 58 California counties.
CA Value
(1.5%)
The regional value is compared to the California state value.
US Value
(1.8%)
The regional value is compared to the national value.
Trend
This comparison measures the indicator’s values over multiple time periods.<br>The Mann-Kendall Test for Statistical Significance is used to evaluate the trend<br>over 4 to 10 periods of measure, subject to data availability and comparability.
Education / School Environment
Youth Connectedness to School County: Santa Cruz
Youth Connectedness to School County: Santa Cruz
47%
(2017-2019)
Compared to:

CA Value
(40%)
The regional value is compared to the California state value.
Prior Value
(50%)
Prior Value compares a measured value with the previously measured value. Confidence intervals were not taken into account in determining the direction of the comparison.
Trend
This comparison measures the indicator’s values over multiple time periods.<br>The Mann-Kendall Test for Statistical Significance is used to evaluate the trend<br>over 4 to 10 periods of measure, subject to data availability and comparability.
Education / School Environment
Youth who have Caring Relationships with Adults: 11th Graders
Value
Compared to:
Youth who have Caring Relationships with Adults: 11th Graders County: Santa Cruz
Youth who have Caring Relationships with Adults: 11th Graders County: Santa Cruz
32.2%
(2017-2019)
Compared to:
CA Value
(30.2%)
The regional value is compared to the California state value.
Prior Value
(33.6%)
Prior Value compares a measured value with the previously measured value. Confidence intervals were not taken into account in determining the direction of the comparison.
Trend
This comparison measures the indicator’s values over multiple time periods.<br>The Mann-Kendall Test for Statistical Significance is used to evaluate the trend<br>over 4 to 10 periods of measure, subject to data availability and comparability.
Education / School Environment
Youth who have Caring Relationships with Adults: 9th Graders
Value
Compared to:
Youth who have Caring Relationships with Adults: 9th Graders County: Santa Cruz
Youth who have Caring Relationships with Adults: 9th Graders County: Santa Cruz
28.2%
(2017-2019)
Compared to:
CA Value
(27.0%)
The regional value is compared to the California state value.
Prior Value
(26.6%)
Prior Value compares a measured value with the previously measured value. Confidence intervals were not taken into account in determining the direction of the comparison.
Trend
This comparison measures the indicator’s values over multiple time periods.<br>The Mann-Kendall Test for Statistical Significance is used to evaluate the trend<br>over 4 to 10 periods of measure, subject to data availability and comparability.
Environmental Health / Built Environment
Access to Exercise Opportunities County: Santa Cruz
Access to Exercise Opportunities County: Santa Cruz
97.7%
(2024)
Compared to:
CA Counties
The distribution is based on data from 58 California counties.
CA Value
(94.2%)
The regional value is compared to the California state value.
US Value
(84.1%)
The regional value is compared to the national value.
Prior Value
(96.8%)
Prior Value compares a measured value with the previously measured value. Confidence intervals were not taken into account in determining the direction of the comparison.
Recreation and Fitness Facilities County: Santa Cruz
Recreation and Fitness Facilities County: Santa Cruz
0.13
Facilities per 1,000 population
(2016)
Compared to:
US Value
(0.06 in 2014)
The regional value is compared to the median value of 3,143 U.S. counties and county equivalents.
Prior Value
(0.14)
Prior Value compares a measured value with the previously measured value. Confidence intervals were not taken into account in determining the direction of the comparison.
Trend
This comparison measures the indicator’s values over multiple time periods.<br>The Mann-Kendall Test for Statistical Significance is used to evaluate the trend<br>over 4 to 10 periods of measure, subject to data availability and comparability.
