Search for Indicators
Sexual Orientation and Gender Identity
Collecting data on sexual orientation and gender identity can help identify disparities and contribute to efforts to reduce them.
Currently, only a few large datasets provide disaggregation by sexual orientation or gender identity (see below indicators). Local government organizations, such as the SC County Child Welfare System and County Behavioral Health Services collect self-identified voluntary information pertaining to sexual orientation and gender identity (see state policy and guidance here). See an example of all Behavioral Health clients past and present (both Mental Health and Substance use Disorder's) gender identity data below;
The Santa Cruz County Department of Education shares data on sexual orientation and gender identity through California Healthy Kids Survey on their data portal. Many other local organization collect this data for programming or internal purposes such as the Community Foundation of Santa Cruz County (collects information from staff and board) and grantmaking, such as the Arts Council of Santa Cruz County. Jim Brown, Executive Director of the Arts Council states that they collect this information from grant applicants to "ensure that our grant funding is distributed broadly in support of our diverse community."
In general discussions, the concept of "gender" is often confused with the concept with "sex," and the terms are used interchangeably - they are not the same, see distinctions below:
- Sex or Sex Assigned at Birth: is a label assigned at birth based on a set of physical characteristics one is born with. For example; intersex, female, male
- Sexual orientation is a pattern of emotional, romantic and/or sexual attractions. For example: gay, straight, pansexual, bisexual, etc.
- Gender involves the expectations society and people have about behaviors, thoughts and characteristics that go along with a person’s assigned sex.
- Gender identity is a person’s inner understanding of the gender(s) to which they belong or with which they identify. This is each person’s unique knowing or feeling, and is separate from a person’s physical body or appearance (although often related). For example: Trans/transgender (Female, Male), Cisgender, Genderqueer, Non-binary
The County of Santa Cruz workgroup on Data and Equity utilize the above definitions and state that County systems should, at a minimum, track the Female/Male designations and one other choice.
For more recommendations and best practices see the list of resources below.
Adults Who Ever Seriously Thought About Committing Suicide
By exploring the data, we can see that people who identify as bisexual are more likely to think about committing suicide, than those who identify as heterosexual (straight) or homosexual. However, these numbers should be interpreted with caution because the sample sizes are small.
 No significant difference with the overall value
The Williams Institute at the UCLA School of Law has developed two best practices guides for data collection to help design survey instruments.
- Guide for Asking Questions about Sexual Orientation
- Guide for Asking Questions about Gender Identity
Explore the reports below to learn more about best practices.

- People who identify as bisexual are more likely to report psychological distress than people who identify as heterosexual or homosexual.
- Transgender students are more likely to report chronic depression and seriously consider suicide than non-LGBT students.
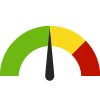
Indicator Gauge Icon Legend
Legend Colors
Red is bad, green is good, blue is not statistically different/neutral.
Compared to Distribution
 the value is in the best half of communities.
 the value is in the 2nd worst quarter of communities.
 the value is in the worst quarter of communities.
Compared to Target
 meets target;
  does not meet target.
Compared to a Single Value
 lower than the comparison value;
 higher than the comparison value;
 not statistically different from comparison value.
Trend

 non-significant change over time;
 significant change over time;
  no change over time.
Compared to Prior Value
 higher than the previous measurement period;
 lower than the previous measurement period;
 no statistically different change from previous measurement period.
 Significantly better than the overall value
 Significantly worse than the overall value
 Significantly different than the overall value
No significant difference with the overall value
 No data on significance available
Health / Health Care Access & Quality
Health / Health Care Access & Quality
County: Santa Cruz
Value
Compared to:
County: Santa Cruz Adults who have had a Routine Checkup
County: Santa Cruz Adults who have had a Routine Checkup
68.5%
(2022)
Compared to:

CA Counties
The distribution is based on data from 58 California counties.
CA Value
(67.0%)
The regional value is compared to the California state value.
Prior Value
(61.1%)
Prior Value compares a measured value with the previously measured value. Confidence intervals were taken into account in determining the direction of the comparison.
Trend
This comparison measures the indicator’s values over multiple time periods.<br>The Mann-Kendall Test for Statistical Significance is used to evaluate the trend<br>over 4 to 10 periods of measure, subject to data availability and comparability.
Health / Mental Health & Mental Disorders
Health / Mental Health & Mental Disorders
County: Santa Cruz
Value
Compared to:
County: Santa Cruz Adults Needing and Receiving Behavioral Health Care Services
County: Santa Cruz Adults Needing and Receiving Behavioral Health Care Services
67.0%
(2021-2022)
Compared to:
CA Counties
The distribution is based on data from 58 California counties.
CA Value
(55.9%)
The regional value is compared to the California state value.
Prior Value
(58.0%)
Prior Value compares a measured value with the previously measured value. Confidence intervals were taken into account in determining the direction of the comparison.
Trend
This comparison measures the indicator’s values over multiple time periods.<br>The Mann-Kendall Test for Statistical Significance is used to evaluate the trend<br>over 4 to 10 periods of measure, subject to data availability and comparability.
County: Santa Cruz Adults Who Ever Thought Seriously About Suicide
County: Santa Cruz Adults Who Ever Thought Seriously About Suicide
20.2%
(2021-2022)
Compared to:


CA Counties
The distribution is based on data from 58 California counties.
CA Value
(19.0%)
The regional value is compared to the California state value.
Prior Value
(22.1%)
Prior Value compares a measured value with the previously measured value. Confidence intervals were taken into account in determining the direction of the comparison.
Trend
This comparison measures the indicator’s values over multiple time periods.<br>The Mann-Kendall Test for Statistical Significance is used to evaluate the trend<br>over 4 to 10 periods of measure, subject to data availability and comparability.
County: Santa Cruz Adults with Likely Serious Psychological Distress
County: Santa Cruz Adults with Likely Serious Psychological Distress
17.9%
(2021-2022)
Compared to:
CA Counties
The distribution is based on data from 58 California counties.
CA Value
(16.7%)
The regional value is compared to the California state value.
Prior Value
(20.4%)
Prior Value compares a measured value with the previously measured value. Confidence intervals were taken into account in determining the direction of the comparison.
Trend
This comparison measures the indicator’s values over multiple time periods.<br>The Mann-Kendall Test for Statistical Significance is used to evaluate the trend<br>over 4 to 10 periods of measure, subject to data availability and comparability.
County: Santa Cruz Students Seriously Considering Suicide
County: Santa Cruz Students Seriously Considering Suicide
14.0%
Percent (%)
(2021)
Compared to:
Prior Value
(14.0%)
Prior Value compares a measured value with the previously measured value. Confidence intervals were not taken into account in determining the direction of the comparison.
Trend
This comparison measures the indicator’s values over multiple time periods.<br>The Mann-Kendall Test for Statistical Significance is used to evaluate the trend<br>over 4 to 10 periods of measure, subject to data availability and comparability.
County: Santa Cruz Students with Chronic Depression
County: Santa Cruz Students with Chronic Depression
44.0%
(2021)
Compared to:


Prior Value
(31.0%)
Prior Value compares a measured value with the previously measured value. Confidence intervals were not taken into account in determining the direction of the comparison.
Trend
This comparison measures the indicator’s values over multiple time periods.<br>The Mann-Kendall Test for Statistical Significance is used to evaluate the trend<br>over 4 to 10 periods of measure, subject to data availability and comparability.
Health / Respiratory Diseases
Health / Respiratory Diseases
County: Santa Cruz
Value
Compared to:
County: Santa Cruz Adults with Asthma
County: Santa Cruz Adults with Asthma
17.7%
(2022)
Compared to:
CA Counties
The distribution is based on data from 58 California counties.
CA Value
(17.0%)
The regional value is compared to the California state value.
US Value
(15.7%)
The regional value is compared to the national value. The source for the national value is Behavioral Risk Factor Surveillance System
Prior Value
(17.2%)
Prior Value compares a measured value with the previously measured value. Confidence intervals were taken into account in determining the direction of the comparison.
Trend
This comparison measures the indicator’s values over multiple time periods.<br>The Mann-Kendall Test for Statistical Significance is used to evaluate the trend<br>over 4 to 10 periods of measure, subject to data availability and comparability.
Health / Tobacco Use
Health / Tobacco Use
County: Santa Cruz
Value
Compared to:
County: Santa Cruz Adults who Smoke
County: Santa Cruz Adults who Smoke
2.1%
(2021-2022)
Compared to:
CA Counties
The distribution is based on data from 58 California counties.
CA Value
(6.1%)
The regional value is compared to the California state value.
US Value
(14.0% in 2022)
The regional value is compared to the national value. The source for the national value is Behavioral Risk Factor Surveillance System
Prior Value
(2.1%)
Prior Value compares a measured value with the previously measured value. Confidence intervals were taken into account in determining the direction of the comparison.
Trend
This comparison measures the indicator’s values over multiple time periods.<br>The Mann-Kendall Test for Statistical Significance is used to evaluate the trend<br>over 4 to 10 periods of measure, subject to data availability and comparability.
HP 2030 Target
(6.1%)
<div>TU-02: Reduce current cigarette smoking in adults <strong>(LEADING HEALTH INDICATOR)</strong></div>
Health / Weight Status
Health / Weight Status
County: Santa Cruz
Value
Compared to:
County: Santa Cruz Adults Who Are Obese
County: Santa Cruz Adults Who Are Obese
20.3%
(2022)
Compared to:
CA Counties
The distribution is based on data from 58 California counties.
CA Value
(28.8%)
The regional value is compared to the California state value.
US Value
(33.6%)
The regional value is compared to the national value. The source for the national value is Behavioral Risk Factor Surveillance System
Prior Value
(25.8%)
Prior Value compares a measured value with the previously measured value. Confidence intervals were taken into account in determining the direction of the comparison.
Trend
This comparison measures the indicator’s values over multiple time periods.<br>The Mann-Kendall Test for Statistical Significance is used to evaluate the trend<br>over 4 to 10 periods of measure, subject to data availability and comparability.
County: Santa Cruz Adults who are Overweight or Obese
County: Santa Cruz Adults who are Overweight or Obese
55.8%
(2022)
Compared to:
CA Counties
The distribution is based on data from 58 California counties.
CA Value
(62.3%)
The regional value is compared to the California state value.
US Value
(67.7%)
The regional value is compared to the national value. The source for the national value is Behavioral Risk Factor Surveillance System
Prior Value
(59.0%)
Prior Value compares a measured value with the previously measured value. Confidence intervals were taken into account in determining the direction of the comparison.
Trend
This comparison measures the indicator’s values over multiple time periods.<br>The Mann-Kendall Test for Statistical Significance is used to evaluate the trend<br>over 4 to 10 periods of measure, subject to data availability and comparability.
