Search for Indicators
Safety Net Clinic Coalition
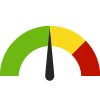
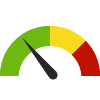
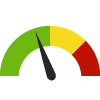
Indicator Gauge Icon Legend
Legend Colors
Red is bad, green is good, blue is not statistically different/neutral.
Compared to Distribution
 the value is in the best half of communities.
 the value is in the 2nd worst quarter of communities.
 the value is in the worst quarter of communities.
Compared to Target
 meets target;
  does not meet target.
Compared to a Single Value
 lower than the comparison value;
 higher than the comparison value;
 not statistically different from comparison value.
Trend

 non-significant change over time;
 significant change over time;
  no change over time.
Compared to Prior Value
 higher than the previous measurement period;
 lower than the previous measurement period;
 no statistically different change from previous measurement period.
Health / Health Care Access & Quality
Health / Health Care Access & Quality
County: Santa Cruz
Value
Compared to:
County: Santa Cruz Adults Delayed or had Difficulty Obtaining Care
County: Santa Cruz Adults Delayed or had Difficulty Obtaining Care
26.7%
(2019-2020)
Compared to:


CA Value
(22.0%)
The regional value is compared to the California state value.
Prior Value
(24.7%)
Prior Value compares a measured value with the previously measured value. Confidence intervals were taken into account in determining the direction of the comparison.
Trend
This comparison measures the indicator’s values over multiple time periods.<br>The Mann-Kendall Test for Statistical Significance is used to evaluate the trend<br>over 4 to 10 periods of measure, subject to data availability and comparability.
County: Santa Cruz Adults Needing and Receiving Behavioral Health Care Services
County: Santa Cruz Adults Needing and Receiving Behavioral Health Care Services
67.0%
(2021-2022)
Compared to:


CA Counties
The distribution is based on data from 58 California counties.
CA Value
(55.9%)
The regional value is compared to the California state value.
Prior Value
(58.0%)
Prior Value compares a measured value with the previously measured value. Confidence intervals were taken into account in determining the direction of the comparison.
Trend
This comparison measures the indicator’s values over multiple time periods.<br>The Mann-Kendall Test for Statistical Significance is used to evaluate the trend<br>over 4 to 10 periods of measure, subject to data availability and comparability.
County: Santa Cruz Adults who have had a Routine Checkup
County: Santa Cruz Adults who have had a Routine Checkup
68.5%
(2022)
Compared to:
CA Counties
The distribution is based on data from 58 California counties.
CA Value
(67.0%)
The regional value is compared to the California state value.
Prior Value
(61.1%)
Prior Value compares a measured value with the previously measured value. Confidence intervals were taken into account in determining the direction of the comparison.
Trend
This comparison measures the indicator’s values over multiple time periods.<br>The Mann-Kendall Test for Statistical Significance is used to evaluate the trend<br>over 4 to 10 periods of measure, subject to data availability and comparability.
County: Santa Cruz Adults with Health Insurance
County: Santa Cruz Adults with Health Insurance
93.7%
(2022)
Compared to:

CA Counties
The distribution is based on data from 42 California counties.
U.S. Counties
The distribution is based on data from 828 U.S. counties and county equivalents.
CA Value
(90.9%)
The regional value is compared to the California state value.
US Value
(88.7%)
The regional value is compared to the national value.
Prior Value
(90.0%)
Prior Value compares a measured value with the previously measured value. Confidence intervals were taken into account in determining the direction of the comparison.
Trend
This comparison measures the indicator’s values over multiple time periods.<br>The Mann-Kendall Test for Statistical Significance is used to evaluate the trend<br>over 4 to 10 periods of measure, subject to data availability and comparability.
County: Santa Cruz Adults with Health Insurance: 18-64
County: Santa Cruz Adults with Health Insurance: 18-64
94.3%
(2019-2020)
Compared to:
CA Value
(90.0%)
The regional value is compared to the California state value.
Prior Value
(86.7%)
Prior Value compares a measured value with the previously measured value. Confidence intervals were taken into account in determining the direction of the comparison.
County: Santa Cruz Adults without Health Insurance
County: Santa Cruz Adults without Health Insurance
8.8%
(2021)
Compared to:
CA Counties
The distribution is based on data from 58 California counties.
U.S. Counties
The distribution is based on data from 3,074 U.S. counties and county equivalents.
US Value
(10.8%)
The regional value is compared to the national value.
County: Santa Cruz Average Gross Premium for Covered California Enrollees
County: Santa Cruz Average Gross Premium for Covered California Enrollees
$690.0
(December 2022)
Compared to:

Prior Value
($692.0)
Prior Value compares a measured value with the previously measured value. Confidence intervals were not taken into account in determining the direction of the comparison.
Trend
This comparison measures the indicator’s values over multiple time periods.<br>The Mann-Kendall Test for Statistical Significance is used to evaluate the trend<br>over 4 to 10 periods of measure, subject to data availability and comparability.
County: Santa Cruz Children and Teens Delayed or had Difficulty Obtaining Care
County: Santa Cruz Children and Teens Delayed or had Difficulty Obtaining Care
6.5%
(2019-2020)
Compared to:
CA Value
(8.7%)
The regional value is compared to the California state value.
Prior Value
(11.1%)
Prior Value compares a measured value with the previously measured value. Confidence intervals were taken into account in determining the direction of the comparison.
County: Santa Cruz Children with Health Insurance
County: Santa Cruz Children with Health Insurance
98.6%
(2022)
Compared to:
CA Counties
The distribution is based on data from 42 California counties.
U.S. Counties
The distribution is based on data from 828 U.S. counties and county equivalents.
CA Value
(96.8%)
The regional value is compared to the California state value.
US Value
(94.9%)
The regional value is compared to the national value.
Prior Value
(95.5%)
Prior Value compares a measured value with the previously measured value. Confidence intervals were taken into account in determining the direction of the comparison.
Trend
This comparison measures the indicator’s values over multiple time periods.<br>The Mann-Kendall Test for Statistical Significance is used to evaluate the trend<br>over 4 to 10 periods of measure, subject to data availability and comparability.
County: Santa Cruz Community Spending on Health Care
County: Santa Cruz Community Spending on Health Care
6.6%
(2023)
Compared to:


CA Value
(6.4%)
The regional value is compared to the California state value.
US Value
(8.0%)
The regional value is compared to the national value.
Prior Value
(6.6%)
Prior Value compares a measured value with the previously measured value. Confidence intervals were not taken into account in determining the direction of the comparison.
County: Santa Cruz Health Insurance Spending-to-Income Ratio
County: Santa Cruz Health Insurance Spending-to-Income Ratio
4.5%
(2023)
Compared to:
CA Counties
The distribution is based on data from 58 California counties.
U.S. Counties
The distribution is based on data from 3,141 U.S. counties and county equivalents.
CA Value
(5.0%)
The regional value is compared to the California state value.
Prior Value
(4.5%)
Prior Value compares a measured value with the previously measured value. Confidence intervals were not taken into account in determining the direction of the comparison.
County: Santa Cruz Individuals Utilizing Behavioral Health Services at the County of Santa Cruz
County: Santa Cruz Individuals Utilizing Behavioral Health Services at the County of Santa Cruz
3,747
People
(2022-2023)
Compared to:


Prior Value
(3,448)
Prior Value compares a measured value with the previously measured value. Confidence intervals were not taken into account in determining the direction of the comparison.
Trend
This comparison measures the indicator’s values over multiple time periods.<br>The Mann-Kendall Test for Statistical Significance is used to evaluate the trend<br>over 4 to 10 periods of measure, subject to data availability and comparability.
County: Santa Cruz Mental Health Provider Rate
County: Santa Cruz Mental Health Provider Rate
951
Providers per 100,000 population
(2023)
Compared to:
CA Counties
The distribution is based on data from 58 California counties.
U.S. Counties
The distribution is based on data from 2,956 U.S. counties and county equivalents.
CA Value
(450)
The regional value is compared to the California state value.
Prior Value
(914)
Prior Value compares a measured value with the previously measured value. Confidence intervals were not taken into account in determining the direction of the comparison.
Trend
This comparison measures the indicator’s values over multiple time periods.<br>The Mann-Kendall Test for Statistical Significance is used to evaluate the trend<br>over 4 to 10 periods of measure, subject to data availability and comparability.
County: Santa Cruz Non-Physician Primary Care Provider Rate
County: Santa Cruz Non-Physician Primary Care Provider Rate
97
Providers per 100,000 population
(2023)
Compared to:
CA Counties
The distribution is based on data from 58 California counties.
U.S. Counties
The distribution is based on data from 3,129 U.S. counties and county equivalents.
CA Value
(87)
The regional value is compared to the California state value.
Prior Value
(90)
Prior Value compares a measured value with the previously measured value. Confidence intervals were not taken into account in determining the direction of the comparison.
Trend
This comparison measures the indicator’s values over multiple time periods.<br>The Mann-Kendall Test for Statistical Significance is used to evaluate the trend<br>over 4 to 10 periods of measure, subject to data availability and comparability.
County: Santa Cruz People Delayed or had Difficulty Obtaining Care
County: Santa Cruz People Delayed or had Difficulty Obtaining Care
21.4%
(2021-2022)
Compared to:

CA Counties
The distribution is based on data from 58 California counties.
CA Value
(16.5%)
The regional value is compared to the California state value.
Prior Value
(21.9%)
Prior Value compares a measured value with the previously measured value. Confidence intervals were taken into account in determining the direction of the comparison.
Trend
This comparison measures the indicator’s values over multiple time periods.<br>The Mann-Kendall Test for Statistical Significance is used to evaluate the trend<br>over 4 to 10 periods of measure, subject to data availability and comparability.
HP 2030 Target
(5.9%)
County: Santa Cruz People with a Usual Source of Health Care
County: Santa Cruz People with a Usual Source of Health Care
84.5%
(2022)
Compared to:
CA Counties
The distribution is based on data from 58 California counties.
CA Value
(82.5%)
The regional value is compared to the California state value.
Prior Value
(88.0%)
Prior Value compares a measured value with the previously measured value. Confidence intervals were taken into account in determining the direction of the comparison.
Trend
This comparison measures the indicator’s values over multiple time periods.<br>The Mann-Kendall Test for Statistical Significance is used to evaluate the trend<br>over 4 to 10 periods of measure, subject to data availability and comparability.
County: Santa Cruz Persons with Health Insurance
County: Santa Cruz Persons with Health Insurance
92.3%
(2021)
Compared to:
CA Counties
The distribution is based on data from 58 California counties.
U.S. Counties
The distribution is based on data from 3,140 U.S. counties and county equivalents.
CA Value
(91.9%)
The regional value is compared to the California state value.
Prior Value
(92.0%)
Prior Value compares a measured value with the previously measured value. Confidence intervals were taken into account in determining the direction of the comparison.
Trend
This comparison measures the indicator’s values over multiple time periods.<br>The Mann-Kendall Test for Statistical Significance is used to evaluate the trend<br>over 4 to 10 periods of measure, subject to data availability and comparability.
HP 2030 Target
(92.4%)
<div>AHS-01: Increase the proportion of people with health insurance <strong>(LEADING HEALTH INDICATOR)</strong></div>
County: Santa Cruz Persons with Private Health Insurance Only
County: Santa Cruz Persons with Private Health Insurance Only
57.6%
(2022)
Compared to:
CA Value
(53.5%)
The regional value is compared to the California state value.
US Value
(54.8%)
The regional value is compared to the national value.
Prior Value
(57.2%)
Prior Value compares a measured value with the previously measured value. Confidence intervals were not taken into account in determining the direction of the comparison.
Trend
This comparison measures the indicator’s values over multiple time periods.<br>The Mann-Kendall Test for Statistical Significance is used to evaluate the trend<br>over 4 to 10 periods of measure, subject to data availability and comparability.
County: Santa Cruz Persons with Public Health Insurance Only
County: Santa Cruz Persons with Public Health Insurance Only
24.8%
(2022)
Compared to:
CA Value
(29.8%)
The regional value is compared to the California state value.
US Value
(24.8%)
The regional value is compared to the national value.
Prior Value
(22.6%)
Prior Value compares a measured value with the previously measured value. Confidence intervals were not taken into account in determining the direction of the comparison.
Trend
This comparison measures the indicator’s values over multiple time periods.<br>The Mann-Kendall Test for Statistical Significance is used to evaluate the trend<br>over 4 to 10 periods of measure, subject to data availability and comparability.
County: Santa Cruz Preventable Hospital Stays: Medicare Population
County: Santa Cruz Preventable Hospital Stays: Medicare Population
1,618.0
Discharges per 100,000 Medicare enrollees
(2022)
Compared to:
CA Counties
The distribution is based on data from 58 California counties.
U.S. Counties
The distribution is based on data from 3,129 U.S. counties and county equivalents.
CA Value
(2,275.0)
The regional value is compared to the California state value.
US Value
(2,677.0)
The regional value is compared to the national value.
Prior Value
(1,569.0)
Prior Value compares a measured value with the previously measured value. Confidence intervals were not taken into account in determining the direction of the comparison.
Trend
This comparison measures the indicator’s values over multiple time periods.<br>The Mann-Kendall Test for Statistical Significance is used to evaluate the trend<br>over 4 to 10 periods of measure, subject to data availability and comparability.
County: Santa Cruz Primary Care Provider Rate
County: Santa Cruz Primary Care Provider Rate
102
Providers per 100,000 population
(2021)
Compared to:

CA Counties
The distribution is based on data from 57 California counties.
U.S. Counties
The distribution is based on data from 2,984 U.S. counties and county equivalents.
CA Value
(81)
The regional value is compared to the California state value.
Prior Value
(104)
Prior Value compares a measured value with the previously measured value. Confidence intervals were not taken into account in determining the direction of the comparison.
Trend
This comparison measures the indicator’s values over multiple time periods.<br>The Mann-Kendall Test for Statistical Significance is used to evaluate the trend<br>over 4 to 10 periods of measure, subject to data availability and comparability.
County: Santa Cruz Residents Who Reported Receiving the Healthcare They Needed
County: Santa Cruz Residents Who Reported Receiving the Healthcare They Needed
88.2%
(2019)
Compared to:
Prior Value
(87.7%)
Prior Value compares a measured value with the previously measured value. Confidence intervals were not taken into account in determining the direction of the comparison.
County: Santa Cruz Salud Para La Gente Patients who are Uninsured
County: Santa Cruz Salud Para La Gente Patients who are Uninsured
13.0%
(2018)
Compared to:
CA Value
(5.5%)
The regional value is compared to the California state value.
US Value
(8.8%)
The regional value is compared to the national value.
Health / Oral Health
Health / Oral Health
County: Santa Cruz
Value
Compared to:
County: Santa Cruz Adults 65+ with Total Tooth Loss
County: Santa Cruz Adults 65+ with Total Tooth Loss
8.2%
(2020)
Compared to:
CA Counties
The distribution is based on data from 58 California counties.
U.S. Counties
The distribution is based on data from 3,141 U.S. counties and county equivalents.
US Value
(13.4%)
The regional value is compared to the national value.
County: Santa Cruz Adults who Visited a Dentist
County: Santa Cruz Adults who Visited a Dentist
65.5%
(2020)
Compared to:
CA Counties
The distribution is based on data from 58 California counties.
U.S. Counties
The distribution is based on data from 3,141 U.S. counties and county equivalents.
US Value
(64.8%)
The regional value is compared to the national value.
County: Santa Cruz Children who Visited a Dentist
County: Santa Cruz Children who Visited a Dentist
97.1%
(2017-2018)
Compared to:
CA Value
(91.9%)
The regional value is compared to the California state value.
Prior Value
(92.9%)
Prior Value compares a measured value with the previously measured value. Confidence intervals were taken into account in determining the direction of the comparison.
County: Santa Cruz Dentist Rate
County: Santa Cruz Dentist Rate
90
Dentists per 100,000 population
(2022)
Compared to:

CA Counties
The distribution is based on data from 58 California counties.
U.S. Counties
The distribution is based on data from 3,054 U.S. counties and county equivalents.
CA Value
(93)
The regional value is compared to the California state value.
Prior Value
(86)
Prior Value compares a measured value with the previously measured value. Confidence intervals were not taken into account in determining the direction of the comparison.
Trend
This comparison measures the indicator’s values over multiple time periods.<br>The Mann-Kendall Test for Statistical Significance is used to evaluate the trend<br>over 4 to 10 periods of measure, subject to data availability and comparability.
County: Santa Cruz Oral Cavity and Pharynx Cancer Incidence Rate
County: Santa Cruz Oral Cavity and Pharynx Cancer Incidence Rate
11.9
Cases per 100,000 population
(2016-2020)
Compared to:
CA Counties
The distribution is based on data from 54 California counties.
U.S. Counties
The distribution is based on data from 1,706 U.S. counties and county equivalents.
CA Value
(10.1)
The regional value is compared to the California state value.
US Value
(11.9)
The regional value is compared to the national value.
Prior Value
(11.2)
Prior Value compares a measured value with the previously measured value. Confidence intervals were taken into account in determining the direction of the comparison.
Trend
This comparison measures the indicator’s values over multiple time periods.<br>The Mann-Kendall Test for Statistical Significance is used to evaluate the trend<br>over 4 to 10 periods of measure, subject to data availability and comparability.
