Search for Indicators
Physical Health Status
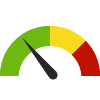
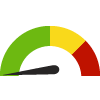
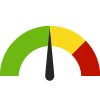
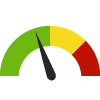
Indicator Gauge Icon Legend
Legend Colors
Red is bad, green is good, blue is not statistically different/neutral.
Compared to Distribution
 the value is in the best half of communities.
 the value is in the 2nd worst quarter of communities.
 the value is in the worst quarter of communities.
Compared to Target
 meets target;
  does not meet target.
Compared to a Single Value
 lower than the comparison value;
 higher than the comparison value;
 not statistically different from comparison value.
Trend

 non-significant change over time;
 significant change over time;
  no change over time.
Compared to Prior Value
 higher than the previous measurement period;
 lower than the previous measurement period;
 no statistically different change from previous measurement period.
Health / Diabetes
Health / Diabetes
County: Santa Cruz
Value
Compared to:
County: Santa Cruz Adults with Diabetes
County: Santa Cruz Adults with Diabetes
10.2%
(2021-2022)
Compared to:

CA Counties
The distribution is based on data from 58 California counties.
CA Value
(10.7%)
The regional value is compared to the California state value.
US Value
(11.5% in 2022)
The regional value is compared to the national value. The source for the national value is Behavioral Risk Factor Surveillance System
Prior Value
(7.8%)
Prior Value compares a measured value with the previously measured value. Confidence intervals were taken into account in determining the direction of the comparison.
Trend
This comparison measures the indicator’s values over multiple time periods.<br>The Mann-Kendall Test for Statistical Significance is used to evaluate the trend<br>over 4 to 10 periods of measure, subject to data availability and comparability.
County: Santa Cruz Age-Adjusted Death Rate due to Diabetes
County: Santa Cruz Age-Adjusted Death Rate due to Diabetes
13.0
Deaths per 100,000 population
(2019-2021)
Compared to:

CA Counties
The distribution is based on data from 57 California counties.
CA Value
(23.1)
The regional value is compared to the California state value.
US Value
(24.8 in 2020)
The regional value is compared to the national value. The source for the national value is Centers for Disease Control and Prevention
Prior Value
(13.0)
Prior Value compares a measured value with the previously measured value. Confidence intervals were taken into account in determining the direction of the comparison.
Trend
This comparison measures the indicator’s values over multiple time periods.<br>The Mann-Kendall Test for Statistical Significance is used to evaluate the trend<br>over 4 to 10 periods of measure, subject to data availability and comparability.
County: Santa Cruz Diabetes: Medicare Population
County: Santa Cruz Diabetes: Medicare Population
15.0%
(2022)
Compared to:
CA Counties
The distribution is based on data from 58 California counties.
U.S. Counties
The distribution is based on data from 3,129 U.S. counties and county equivalents.
CA Value
(21.0%)
The regional value is compared to the California state value.
US Value
(24.0%)
The regional value is compared to the national value.
Prior Value
(16.0%)
Prior Value compares a measured value with the previously measured value. Confidence intervals were not taken into account in determining the direction of the comparison.
Trend
This comparison measures the indicator’s values over multiple time periods.<br>The Mann-Kendall Test for Statistical Significance is used to evaluate the trend<br>over 4 to 10 periods of measure, subject to data availability and comparability.
County: Santa Cruz Diabetic Monitoring: Medicare Population
County: Santa Cruz Diabetic Monitoring: Medicare Population
87.8%
(2019)
Compared to:
CA Counties
The distribution is based on data from 58 California counties.
U.S. Counties
The distribution is based on data from 3,097 U.S. counties and county equivalents.
CA Value
(84.4%)
The regional value is compared to the California state value.
US Value
(87.5%)
The regional value is compared to the national value.
Prior Value
(89.8%)
Prior Value compares a measured value with the previously measured value. Confidence intervals were taken into account in determining the direction of the comparison.
Trend
This comparison measures the indicator’s values over multiple time periods.<br>The Mann-Kendall Test for Statistical Significance is used to evaluate the trend<br>over 4 to 10 periods of measure, subject to data availability and comparability.
Health / Disabilities
Health / Disabilities
County: Santa Cruz
Value
Compared to:
County: Santa Cruz Persons with a Disability
County: Santa Cruz Persons with a Disability
11.7%
(2018-2022)
Compared to:


CA Value
(11.0%)
The regional value is compared to the California state value.
US Value
(12.9%)
The regional value is compared to the national value.
Trend
This comparison measures the indicator’s values over multiple time periods.<br>The Mann-Kendall Test for Statistical Significance is used to evaluate the trend<br>over 4 to 10 periods of measure, subject to data availability and comparability.
Health / Heart Disease & Stroke
Health / Heart Disease & Stroke
County: Santa Cruz
Value
Compared to:
County: Santa Cruz Adults with Heart Disease
County: Santa Cruz Adults with Heart Disease
7.0%
(2019-2020)
Compared to:


CA Value
(6.9%)
The regional value is compared to the California state value.
Prior Value
(6.7%)
Prior Value compares a measured value with the previously measured value. Confidence intervals were taken into account in determining the direction of the comparison.
Trend
This comparison measures the indicator’s values over multiple time periods.<br>The Mann-Kendall Test for Statistical Significance is used to evaluate the trend<br>over 4 to 10 periods of measure, subject to data availability and comparability.
County: Santa Cruz Age-Adjusted Death Rate due to Cerebrovascular Disease (Stroke)
County: Santa Cruz Age-Adjusted Death Rate due to Cerebrovascular Disease (Stroke)
35.2
Deaths per 100,000 population
(2019-2021)
Compared to:
CA Counties
The distribution is based on data from 58 California counties.
CA Value
(37.2)
The regional value is compared to the California state value.
US Value
(38.8 in 2020)
The regional value is compared to the national value. The source for the national value is Centers for Disease Control and Prevention
Prior Value
(32.2)
Prior Value compares a measured value with the previously measured value. Confidence intervals were taken into account in determining the direction of the comparison.
Trend
This comparison measures the indicator’s values over multiple time periods.<br>The Mann-Kendall Test for Statistical Significance is used to evaluate the trend<br>over 4 to 10 periods of measure, subject to data availability and comparability.
HP 2030 Target
(33.4)
County: Santa Cruz Age-Adjusted Death Rate due to Coronary Heart Disease
County: Santa Cruz Age-Adjusted Death Rate due to Coronary Heart Disease
48.5
Deaths per 100,000 population
(2019-2021)
Compared to:
CA Counties
The distribution is based on data from 58 California counties.
CA Value
(79.0)
The regional value is compared to the California state value.
US Value
(91.8 in 2020)
The regional value is compared to the national value. The source for the national value is Centers for Disease Control and Prevention
Prior Value
(53.0)
Prior Value compares a measured value with the previously measured value. Confidence intervals were taken into account in determining the direction of the comparison.
Trend
This comparison measures the indicator’s values over multiple time periods.<br>The Mann-Kendall Test for Statistical Significance is used to evaluate the trend<br>over 4 to 10 periods of measure, subject to data availability and comparability.
HP 2030 Target
(71.1)
County: Santa Cruz Age-Adjusted Death Rate due to Heart Attack
County: Santa Cruz Age-Adjusted Death Rate due to Heart Attack
27.0
Deaths per 100,000 population 35+ years
(2020)
Compared to:
CA Counties
The distribution is based on data from 49 California counties.
CA Value
(44.4)
The regional value is compared to the California state value.
Prior Value
(27.5)
Prior Value compares a measured value with the previously measured value. Confidence intervals were not taken into account in determining the direction of the comparison.
Trend
This comparison measures the indicator’s values over multiple time periods.<br>The Mann-Kendall Test for Statistical Significance is used to evaluate the trend<br>over 4 to 10 periods of measure, subject to data availability and comparability.
County: Santa Cruz Age-Adjusted Hospitalization Rate due to Heart Attack
County: Santa Cruz Age-Adjusted Hospitalization Rate due to Heart Attack
18.4
Hospitalizations per 10,000 population 35+ years
(2018)
Compared to:
CA Counties
The distribution is based on data from 56 California counties.
CA Value
(25.5)
The regional value is compared to the California state value.
Prior Value
(19.5)
Prior Value compares a measured value with the previously measured value. Confidence intervals were not taken into account in determining the direction of the comparison.
Trend
This comparison measures the indicator’s values over multiple time periods.<br>The Mann-Kendall Test for Statistical Significance is used to evaluate the trend<br>over 4 to 10 periods of measure, subject to data availability and comparability.
County: Santa Cruz Atrial Fibrillation: Medicare Population
County: Santa Cruz Atrial Fibrillation: Medicare Population
13.0%
(2022)
Compared to:
CA Counties
The distribution is based on data from 58 California counties.
U.S. Counties
The distribution is based on data from 3,129 U.S. counties and county equivalents.
CA Value
(13.0%)
The regional value is compared to the California state value.
US Value
(14.0%)
The regional value is compared to the national value.
Prior Value
(13.0%)
Prior Value compares a measured value with the previously measured value. Confidence intervals were not taken into account in determining the direction of the comparison.
Trend
This comparison measures the indicator’s values over multiple time periods.<br>The Mann-Kendall Test for Statistical Significance is used to evaluate the trend<br>over 4 to 10 periods of measure, subject to data availability and comparability.
County: Santa Cruz Heart Failure: Medicare Population
County: Santa Cruz Heart Failure: Medicare Population
8.0%
(2022)
Compared to:
CA Counties
The distribution is based on data from 58 California counties.
U.S. Counties
The distribution is based on data from 3,129 U.S. counties and county equivalents.
CA Value
(10.0%)
The regional value is compared to the California state value.
US Value
(11.0%)
The regional value is compared to the national value.
Prior Value
(8.0%)
Prior Value compares a measured value with the previously measured value. Confidence intervals were not taken into account in determining the direction of the comparison.
Trend
This comparison measures the indicator’s values over multiple time periods.<br>The Mann-Kendall Test for Statistical Significance is used to evaluate the trend<br>over 4 to 10 periods of measure, subject to data availability and comparability.
County: Santa Cruz High Blood Pressure Prevalence
County: Santa Cruz High Blood Pressure Prevalence
28.7%
(2021)
Compared to:
CA Counties
The distribution is based on data from 58 California counties.
U.S. Counties
The distribution is based on data from 3,074 U.S. counties and county equivalents.
US Value
(32.7%)
The regional value is compared to the national value.
HP 2030 Target
(41.9%)
County: Santa Cruz Hyperlipidemia: Medicare Population
County: Santa Cruz Hyperlipidemia: Medicare Population
56.0%
(2022)
Compared to:
CA Counties
The distribution is based on data from 58 California counties.
U.S. Counties
The distribution is based on data from 3,129 U.S. counties and county equivalents.
CA Value
(61.0%)
The regional value is compared to the California state value.
US Value
(65.0%)
The regional value is compared to the national value.
Prior Value
(54.0%)
Prior Value compares a measured value with the previously measured value. Confidence intervals were not taken into account in determining the direction of the comparison.
Trend
This comparison measures the indicator’s values over multiple time periods.<br>The Mann-Kendall Test for Statistical Significance is used to evaluate the trend<br>over 4 to 10 periods of measure, subject to data availability and comparability.
County: Santa Cruz Hypertension: Medicare Population
County: Santa Cruz Hypertension: Medicare Population
51.0%
(2022)
Compared to:
CA Counties
The distribution is based on data from 58 California counties.
U.S. Counties
The distribution is based on data from 3,129 U.S. counties and county equivalents.
CA Value
(58.0%)
The regional value is compared to the California state value.
US Value
(65.0%)
The regional value is compared to the national value.
Prior Value
(51.0%)
Prior Value compares a measured value with the previously measured value. Confidence intervals were not taken into account in determining the direction of the comparison.
Trend
This comparison measures the indicator’s values over multiple time periods.<br>The Mann-Kendall Test for Statistical Significance is used to evaluate the trend<br>over 4 to 10 periods of measure, subject to data availability and comparability.
County: Santa Cruz Ischemic Heart Disease: Medicare Population
County: Santa Cruz Ischemic Heart Disease: Medicare Population
13.0%
(2022)
Compared to:
CA Counties
The distribution is based on data from 58 California counties.
U.S. Counties
The distribution is based on data from 3,129 U.S. counties and county equivalents.
CA Value
(18.0%)
The regional value is compared to the California state value.
US Value
(21.0%)
The regional value is compared to the national value.
Prior Value
(13.0%)
Prior Value compares a measured value with the previously measured value. Confidence intervals were not taken into account in determining the direction of the comparison.
Trend
This comparison measures the indicator’s values over multiple time periods.<br>The Mann-Kendall Test for Statistical Significance is used to evaluate the trend<br>over 4 to 10 periods of measure, subject to data availability and comparability.
County: Santa Cruz Stroke: Medicare Population
County: Santa Cruz Stroke: Medicare Population
4.0%
(2022)
Compared to:

CA Counties
The distribution is based on data from 58 California counties.
U.S. Counties
The distribution is based on data from 3,129 U.S. counties and county equivalents.
CA Value
(5.0%)
The regional value is compared to the California state value.
US Value
(6.0%)
The regional value is compared to the national value.
Prior Value
(4.0%)
Prior Value compares a measured value with the previously measured value. Confidence intervals were not taken into account in determining the direction of the comparison.
Trend
This comparison measures the indicator’s values over multiple time periods.<br>The Mann-Kendall Test for Statistical Significance is used to evaluate the trend<br>over 4 to 10 periods of measure, subject to data availability and comparability.
Health / Immunizations & Infectious Diseases
Health / Immunizations & Infectious Diseases
County: Santa Cruz
Value
Compared to:
County: Santa Cruz Age-Adjusted Death Rate due to Influenza and Pneumonia
County: Santa Cruz Age-Adjusted Death Rate due to Influenza and Pneumonia
7.8
Deaths per 100,000 population
(2019-2021)
Compared to:
CA Counties
The distribution is based on data from 57 California counties.
CA Value
(11.5)
The regional value is compared to the California state value.
US Value
(13.0 in 2020)
The regional value is compared to the national value. The source for the national value is Centers for Disease Control and Prevention
Prior Value
(11.0)
Prior Value compares a measured value with the previously measured value. Confidence intervals were taken into account in determining the direction of the comparison.
Trend
This comparison measures the indicator’s values over multiple time periods.<br>The Mann-Kendall Test for Statistical Significance is used to evaluate the trend<br>over 4 to 10 periods of measure, subject to data availability and comparability.
County: Santa Cruz Tuberculosis Incidence Rate
County: Santa Cruz Tuberculosis Incidence Rate
1.8
Cases per 100,000 population
(2018)
Compared to:
CA Counties
(2019)
The distribution is based on data from 31 California counties.
CA Value
(5.3)
The regional value is compared to the California state value.
US Value
(2.8)
The regional value is compared to the national value. The source for the national value is Centers for Disease Control and Prevention
Prior Value
(2.2)
Prior Value compares a measured value with the previously measured value. Confidence intervals were not taken into account in determining the direction of the comparison.
Trend
This comparison measures the indicator’s values over multiple time periods.<br>The Mann-Kendall Test for Statistical Significance is used to evaluate the trend<br>over 4 to 10 periods of measure, subject to data availability and comparability.
HP 2030 Target
(1.4)
Health / Mortality Data
Health / Mortality Data
County: Santa Cruz
Value
Compared to:
County: Santa Cruz Life Expectancy
County: Santa Cruz Life Expectancy
82.1
Years
(2019-2021)
Compared to:
CA Counties
The distribution is based on data from 57 California counties.
U.S. Counties
The distribution is based on data from 3,070 U.S. counties and county equivalents.
CA Value
(79.9)
The regional value is compared to the California state value.
US Value
(77.6)
The regional value is compared to the national value.
Health / Other Conditions
Health / Other Conditions
County: Santa Cruz
Value
Compared to:
County: Santa Cruz Chronic Kidney Disease: Medicare Population
County: Santa Cruz Chronic Kidney Disease: Medicare Population
11.0%
(2022)
Compared to:
CA Counties
The distribution is based on data from 58 California counties.
U.S. Counties
The distribution is based on data from 3,129 U.S. counties and county equivalents.
CA Value
(16.0%)
The regional value is compared to the California state value.
US Value
(18.0%)
The regional value is compared to the national value.
Prior Value
(11.0%)
Prior Value compares a measured value with the previously measured value. Confidence intervals were not taken into account in determining the direction of the comparison.
Trend
This comparison measures the indicator’s values over multiple time periods.<br>The Mann-Kendall Test for Statistical Significance is used to evaluate the trend<br>over 4 to 10 periods of measure, subject to data availability and comparability.
County: Santa Cruz Osteoporosis: Medicare Population
County: Santa Cruz Osteoporosis: Medicare Population
13.0%
(2022)
Compared to:

CA Counties
The distribution is based on data from 58 California counties.
U.S. Counties
The distribution is based on data from 3,129 U.S. counties and county equivalents.
CA Value
(13.0%)
The regional value is compared to the California state value.
US Value
(11.0%)
The regional value is compared to the national value.
Prior Value
(12.0%)
Prior Value compares a measured value with the previously measured value. Confidence intervals were not taken into account in determining the direction of the comparison.
Trend
This comparison measures the indicator’s values over multiple time periods.<br>The Mann-Kendall Test for Statistical Significance is used to evaluate the trend<br>over 4 to 10 periods of measure, subject to data availability and comparability.
County: Santa Cruz Rheumatoid Arthritis or Osteoarthritis: Medicare Population
County: Santa Cruz Rheumatoid Arthritis or Osteoarthritis: Medicare Population
30.0%
(2022)
Compared to:
CA Counties
The distribution is based on data from 58 California counties.
U.S. Counties
The distribution is based on data from 3,129 U.S. counties and county equivalents.
CA Value
(32.0%)
The regional value is compared to the California state value.
US Value
(35.0%)
The regional value is compared to the national value.
Prior Value
(29.0%)
Prior Value compares a measured value with the previously measured value. Confidence intervals were not taken into account in determining the direction of the comparison.
Trend
This comparison measures the indicator’s values over multiple time periods.<br>The Mann-Kendall Test for Statistical Significance is used to evaluate the trend<br>over 4 to 10 periods of measure, subject to data availability and comparability.
Health / Respiratory Diseases
Health / Respiratory Diseases
County: Santa Cruz
Value
Compared to:
County: Santa Cruz Adults with Asthma
County: Santa Cruz Adults with Asthma
17.7%
(2022)
Compared to:
CA Counties
The distribution is based on data from 58 California counties.
CA Value
(17.0%)
The regional value is compared to the California state value.
US Value
(15.7%)
The regional value is compared to the national value. The source for the national value is Behavioral Risk Factor Surveillance System
Prior Value
(17.2%)
Prior Value compares a measured value with the previously measured value. Confidence intervals were taken into account in determining the direction of the comparison.
Trend
This comparison measures the indicator’s values over multiple time periods.<br>The Mann-Kendall Test for Statistical Significance is used to evaluate the trend<br>over 4 to 10 periods of measure, subject to data availability and comparability.
County: Santa Cruz Asthma: Medicare Population
County: Santa Cruz Asthma: Medicare Population
7.0%
(2022)
Compared to:
CA Counties
The distribution is based on data from 58 California counties.
U.S. Counties
The distribution is based on data from 3,129 U.S. counties and county equivalents.
CA Value
(7.0%)
The regional value is compared to the California state value.
US Value
(7.0%)
The regional value is compared to the national value.
Prior Value
(7.0%)
Prior Value compares a measured value with the previously measured value. Confidence intervals were not taken into account in determining the direction of the comparison.
Trend
This comparison measures the indicator’s values over multiple time periods.<br>The Mann-Kendall Test for Statistical Significance is used to evaluate the trend<br>over 4 to 10 periods of measure, subject to data availability and comparability.
County: Santa Cruz COPD: Medicare Population
County: Santa Cruz COPD: Medicare Population
6.0%
(2022)
Compared to:
CA Counties
The distribution is based on data from 58 California counties.
U.S. Counties
The distribution is based on data from 3,129 U.S. counties and county equivalents.
CA Value
(8.0%)
The regional value is compared to the California state value.
US Value
(11.0%)
The regional value is compared to the national value.
Prior Value
(6.0%)
Prior Value compares a measured value with the previously measured value. Confidence intervals were not taken into account in determining the direction of the comparison.
Trend
This comparison measures the indicator’s values over multiple time periods.<br>The Mann-Kendall Test for Statistical Significance is used to evaluate the trend<br>over 4 to 10 periods of measure, subject to data availability and comparability.
Health / Sexually Transmitted Infections
Health / Sexually Transmitted Infections
County: Santa Cruz
Value
Compared to:
County: Santa Cruz Chlamydia Incidence Rate
County: Santa Cruz Chlamydia Incidence Rate
318.8
Cases per 100,000 population
(2021)
Compared to:
CA Counties
The distribution is based on data from 58 California counties.
CA Value
(484.7)
The regional value is compared to the California state value.
US Value
(495.5)
The regional value is compared to the national value. The source for the national value is National Center for HIV/AIDS, Viral Hepatitis, STD, and TB Prevention
Prior Value
(277.3)
Prior Value compares a measured value with the previously measured value. Confidence intervals were not taken into account in determining the direction of the comparison.
Trend
This comparison measures the indicator’s values over multiple time periods.<br>The Mann-Kendall Test for Statistical Significance is used to evaluate the trend<br>over 4 to 10 periods of measure, subject to data availability and comparability.
County: Santa Cruz Congenital Syphilis Incidence Rate
County: Santa Cruz Congenital Syphilis Incidence Rate
91.6
Cases per 100,000 live births
(2020)
Compared to:
CA Counties
The distribution is based on data from 58 California counties.
CA Value
(114.9)
The regional value is compared to the California state value.
Prior Value
(83.5)
Prior Value compares a measured value with the previously measured value. Confidence intervals were not taken into account in determining the direction of the comparison.
Trend
This comparison measures the indicator’s values over multiple time periods.<br>The Mann-Kendall Test for Statistical Significance is used to evaluate the trend<br>over 4 to 10 periods of measure, subject to data availability and comparability.
HP 2030 Target
(33.9)
County: Santa Cruz Death Rate Among Persons with Diagnosed HIV Infection
County: Santa Cruz Death Rate Among Persons with Diagnosed HIV Infection
1.8
Deaths per 100,000 population
(2022)
Compared to:
CA Counties
The distribution is based on data from 58 California counties.
CA Value
(5.4)
The regional value is compared to the California state value.
Prior Value
(1.5)
Prior Value compares a measured value with the previously measured value. Confidence intervals were not taken into account in determining the direction of the comparison.
Trend
This comparison measures the indicator’s values over multiple time periods.<br>The Mann-Kendall Test for Statistical Significance is used to evaluate the trend<br>over 4 to 10 periods of measure, subject to data availability and comparability.
County: Santa Cruz Gonorrhea Incidence Rate
County: Santa Cruz Gonorrhea Incidence Rate
112.5
Cases per 100,000 population
(2021)
Compared to:
CA Counties
The distribution is based on data from 58 California counties.
CA Value
(230.9)
The regional value is compared to the California state value.
US Value
(214.0)
The regional value is compared to the national value. The source for the national value is National Center for HIV/AIDS, Viral Hepatitis, STD, and TB Prevention
Prior Value
(78.1)
Prior Value compares a measured value with the previously measured value. Confidence intervals were not taken into account in determining the direction of the comparison.
Trend
This comparison measures the indicator’s values over multiple time periods.<br>The Mann-Kendall Test for Statistical Significance is used to evaluate the trend<br>over 4 to 10 periods of measure, subject to data availability and comparability.
County: Santa Cruz HIV Diagnosis Rate
County: Santa Cruz HIV Diagnosis Rate
7.6
Cases per 100,000 population
(2022)
Compared to:
CA Counties
The distribution is based on data from 58 California counties.
CA Value
(12.2)
The regional value is compared to the California state value.
Prior Value
(6.5)
Prior Value compares a measured value with the previously measured value. Confidence intervals were not taken into account in determining the direction of the comparison.
Trend
This comparison measures the indicator’s values over multiple time periods.<br>The Mann-Kendall Test for Statistical Significance is used to evaluate the trend<br>over 4 to 10 periods of measure, subject to data availability and comparability.
County: Santa Cruz Persons Living and Diagnosed with HIV who are in Care
County: Santa Cruz Persons Living and Diagnosed with HIV who are in Care
76.4%
(2022)
Compared to:


CA Counties
The distribution is based on data from 56 California counties.
CA Value
(73.7%)
The regional value is compared to the California state value.
Prior Value
(76.9%)
Prior Value compares a measured value with the previously measured value. Confidence intervals were not taken into account in determining the direction of the comparison.
Trend
This comparison measures the indicator’s values over multiple time periods.<br>The Mann-Kendall Test for Statistical Significance is used to evaluate the trend<br>over 4 to 10 periods of measure, subject to data availability and comparability.
County: Santa Cruz Persons Living with HIV Rate
County: Santa Cruz Persons Living with HIV Rate
201.4
Cases per 100,000 population
(2022)
Compared to:

CA Value
(355.6)
The regional value is compared to the California state value.
Prior Value
(473.9)
Prior Value compares a measured value with the previously measured value. Confidence intervals were not taken into account in determining the direction of the comparison.
Trend
This comparison measures the indicator’s values over multiple time periods.<br>The Mann-Kendall Test for Statistical Significance is used to evaluate the trend<br>over 4 to 10 periods of measure, subject to data availability and comparability.
County: Santa Cruz Syphilis Incidence Rate
County: Santa Cruz Syphilis Incidence Rate
24.7
Cases per 100,000 population
(2021)
Compared to:
CA Counties
The distribution is based on data from 58 California counties.
CA Value
(22.3)
The regional value is compared to the California state value.
US Value
(16.2)
The regional value is compared to the national value. The source for the national value is National Center for HIV/AIDS, Viral Hepatitis, STD, and TB Prevention
Prior Value
(13.3)
Prior Value compares a measured value with the previously measured value. Confidence intervals were not taken into account in determining the direction of the comparison.
Trend
This comparison measures the indicator’s values over multiple time periods.<br>The Mann-Kendall Test for Statistical Significance is used to evaluate the trend<br>over 4 to 10 periods of measure, subject to data availability and comparability.
Health / Weight Status
Health / Weight Status
County: Santa Cruz
Value
Compared to:
County: Santa Cruz Adults Who Are Obese
County: Santa Cruz Adults Who Are Obese
20.3%
(2022)
Compared to:
CA Counties
The distribution is based on data from 58 California counties.
CA Value
(28.8%)
The regional value is compared to the California state value.
US Value
(33.6%)
The regional value is compared to the national value. The source for the national value is Behavioral Risk Factor Surveillance System
Prior Value
(25.8%)
Prior Value compares a measured value with the previously measured value. Confidence intervals were taken into account in determining the direction of the comparison.
Trend
This comparison measures the indicator’s values over multiple time periods.<br>The Mann-Kendall Test for Statistical Significance is used to evaluate the trend<br>over 4 to 10 periods of measure, subject to data availability and comparability.
County: Santa Cruz Adults who are Overweight or Obese
County: Santa Cruz Adults who are Overweight or Obese
55.8%
(2022)
Compared to:
CA Counties
The distribution is based on data from 58 California counties.
CA Value
(62.3%)
The regional value is compared to the California state value.
US Value
(67.7%)
The regional value is compared to the national value. The source for the national value is Behavioral Risk Factor Surveillance System
Prior Value
(59.0%)
Prior Value compares a measured value with the previously measured value. Confidence intervals were taken into account in determining the direction of the comparison.
Trend
This comparison measures the indicator’s values over multiple time periods.<br>The Mann-Kendall Test for Statistical Significance is used to evaluate the trend<br>over 4 to 10 periods of measure, subject to data availability and comparability.
Health / Wellness & Lifestyle
Health / Wellness & Lifestyle
County: Santa Cruz
Value
Compared to:
County: Santa Cruz Insufficient Sleep
County: Santa Cruz Insufficient Sleep
30.1%
(2020)
Compared to:
CA Counties
The distribution is based on data from 58 California counties.
U.S. Counties
The distribution is based on data from 3,140 U.S. counties and county equivalents.
CA Value
(31.1%)
The regional value is compared to the California state value.
US Value
(33.0%)
The regional value is compared to the national value.
Prior Value
(30.1%)
Prior Value compares a measured value with the previously measured value. Confidence intervals were not taken into account in determining the direction of the comparison.
HP 2030 Target
(26.7%)
County: Santa Cruz Poor Physical Health: Average Number of Days
County: Santa Cruz Poor Physical Health: Average Number of Days
3.4
Days
(2021)
Compared to:
CA Counties
The distribution is based on data from 58 California counties.
U.S. Counties
The distribution is based on data from 3,141 U.S. counties and county equivalents.
CA Value
(3.1)
The regional value is compared to the California state value.
US Value
(3.3)
The regional value is compared to the national value.
Prior Value
(3.0)
Prior Value compares a measured value with the previously measured value. Confidence intervals were taken into account in determining the direction of the comparison.
Trend
This comparison measures the indicator’s values over multiple time periods.<br>The Mann-Kendall Test for Statistical Significance is used to evaluate the trend<br>over 4 to 10 periods of measure, subject to data availability and comparability.
County: Santa Cruz Self-Reported General Health Assessment: Good or Better
County: Santa Cruz Self-Reported General Health Assessment: Good or Better
94.7%
(2022)
Compared to:
CA Counties
The distribution is based on data from 58 California counties.
CA Value
(86.0%)
The regional value is compared to the California state value.
Prior Value
(87.0%)
Prior Value compares a measured value with the previously measured value. Confidence intervals were taken into account in determining the direction of the comparison.
Trend
This comparison measures the indicator’s values over multiple time periods.<br>The Mann-Kendall Test for Statistical Significance is used to evaluate the trend<br>over 4 to 10 periods of measure, subject to data availability and comparability.
