Search for Indicators
Housing by Region
Indicator Gauge Icon Legend
Legend Colors
Red is bad, green is good, blue is not statistically different/neutral.
Compared to Distribution
 the value is in the best half of communities.
 the value is in the 2nd worst quarter of communities.
 the value is in the worst quarter of communities.
Compared to Target
 meets target;
  does not meet target.
Compared to a Single Value
 lower than the comparison value;
 higher than the comparison value;
 not statistically different from comparison value.
Trend

 non-significant change over time;
 significant change over time;
  no change over time.
Compared to Prior Value
 higher than the previous measurement period;
 lower than the previous measurement period;
 no statistically different change from previous measurement period.
Economy / Housing & Homes
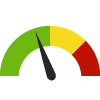
Homeownership Region: Mid-County
Homeownership Region: Mid-County
60.1%
(2018-2022)
Compared to:
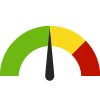
CA Counties
The distribution is based on data from 58 California counties.
U.S. Counties
The distribution is based on data from 3,133 U.S. counties and county equivalents.
Santa Cruz, CA County Value
(54.4%)
The regional value is compared to the Santa Cruz County value.
CA Value
(51.4%)
The regional value is compared to the California state value.
US Value
(57.8%)
The regional value is compared to the national value.
Trend
This comparison measures the indicator’s values over multiple time periods.<br>The Mann-Kendall Test for Statistical Significance is used to evaluate the trend<br>over 4 to 10 periods of measure, subject to data availability and comparability.
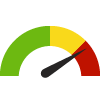
Homeownership Region: North County
Homeownership Region: North County
51.2%
(2018-2022)
Compared to:
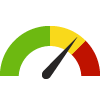

CA Counties
The distribution is based on data from 58 California counties.
U.S. Counties
The distribution is based on data from 3,133 U.S. counties and county equivalents.
Santa Cruz, CA County Value
(54.4%)
The regional value is compared to the Santa Cruz County value.
CA Value
(51.4%)
The regional value is compared to the California state value.
US Value
(57.8%)
The regional value is compared to the national value.
Trend
This comparison measures the indicator’s values over multiple time periods.<br>The Mann-Kendall Test for Statistical Significance is used to evaluate the trend<br>over 4 to 10 periods of measure, subject to data availability and comparability.
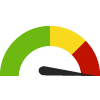
Homeownership Region: San Lorenzo Valley
Homeownership Region: San Lorenzo Valley
68.9%
(2018-2022)
Compared to:
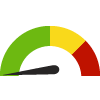

CA Counties
The distribution is based on data from 58 California counties.
U.S. Counties
The distribution is based on data from 3,133 U.S. counties and county equivalents.
Santa Cruz, CA County Value
(54.4%)
The regional value is compared to the Santa Cruz County value.
CA Value
(51.4%)
The regional value is compared to the California state value.
US Value
(57.8%)
The regional value is compared to the national value.
Trend
This comparison measures the indicator’s values over multiple time periods.<br>The Mann-Kendall Test for Statistical Significance is used to evaluate the trend<br>over 4 to 10 periods of measure, subject to data availability and comparability.
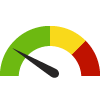
Homeownership Region: South County
Homeownership Region: South County
50.8%
(2018-2022)
Compared to:
CA Counties
The distribution is based on data from 58 California counties.
U.S. Counties
The distribution is based on data from 3,133 U.S. counties and county equivalents.
Santa Cruz, CA County Value
(54.4%)
The regional value is compared to the Santa Cruz County value.
CA Value
(51.4%)
The regional value is compared to the California state value.
US Value
(57.8%)
The regional value is compared to the national value.
Trend
This comparison measures the indicator’s values over multiple time periods.<br>The Mann-Kendall Test for Statistical Significance is used to evaluate the trend<br>over 4 to 10 periods of measure, subject to data availability and comparability.
Economy / Housing & Homes
Renters Spending 30% or More of Household Income on Rent
Value
Compared to:
Renters Spending 30% or More of Household Income on Rent Region: Mid-County
Renters Spending 30% or More of Household Income on Rent Region: Mid-County
49.8%
(2018-2022)
Compared to:
CA Counties
The distribution is based on data from 58 California counties.
U.S. Counties
The distribution is based on data from 3,132 U.S. counties and county equivalents.
Santa Cruz, CA County Value
(52.7%)
The regional value is compared to the Santa Cruz County value.
CA Value
(54.4%)
The regional value is compared to the California state value.
US Value
(49.9%)
The regional value is compared to the national value.
Trend
This comparison measures the indicator’s values over multiple time periods.<br>The Mann-Kendall Test for Statistical Significance is used to evaluate the trend<br>over 4 to 10 periods of measure, subject to data availability and comparability.
HP 2030 Target
(25.5%)
Renters Spending 30% or More of Household Income on Rent Region: North County
Renters Spending 30% or More of Household Income on Rent Region: North County
53.5%
(2018-2022)
Compared to:

CA Counties
The distribution is based on data from 58 California counties.
U.S. Counties
The distribution is based on data from 3,132 U.S. counties and county equivalents.
Santa Cruz, CA County Value
(52.7%)
The regional value is compared to the Santa Cruz County value.
CA Value
(54.4%)
The regional value is compared to the California state value.
US Value
(49.9%)
The regional value is compared to the national value.
Trend
This comparison measures the indicator’s values over multiple time periods.<br>The Mann-Kendall Test for Statistical Significance is used to evaluate the trend<br>over 4 to 10 periods of measure, subject to data availability and comparability.
HP 2030 Target
(25.5%)
Renters Spending 30% or More of Household Income on Rent Region: San Lorenzo Valley
Renters Spending 30% or More of Household Income on Rent Region: San Lorenzo Valley
51.5%
(2018-2022)
Compared to:
CA Counties
The distribution is based on data from 58 California counties.
U.S. Counties
The distribution is based on data from 3,132 U.S. counties and county equivalents.
Santa Cruz, CA County Value
(52.7%)
The regional value is compared to the Santa Cruz County value.
CA Value
(54.4%)
The regional value is compared to the California state value.
US Value
(49.9%)
The regional value is compared to the national value.
Trend
This comparison measures the indicator’s values over multiple time periods.<br>The Mann-Kendall Test for Statistical Significance is used to evaluate the trend<br>over 4 to 10 periods of measure, subject to data availability and comparability.
HP 2030 Target
(25.5%)
Renters Spending 30% or More of Household Income on Rent Region: South County
Renters Spending 30% or More of Household Income on Rent Region: South County
54.5%
(2018-2022)
Compared to:
CA Counties
The distribution is based on data from 58 California counties.
U.S. Counties
The distribution is based on data from 3,132 U.S. counties and county equivalents.
Santa Cruz, CA County Value
(52.7%)
The regional value is compared to the Santa Cruz County value.
CA Value
(54.4%)
The regional value is compared to the California state value.
US Value
(49.9%)
The regional value is compared to the national value.
Trend
This comparison measures the indicator’s values over multiple time periods.<br>The Mann-Kendall Test for Statistical Significance is used to evaluate the trend<br>over 4 to 10 periods of measure, subject to data availability and comparability.
HP 2030 Target
(25.5%)
