Women's Wellbeing in Santa Cruz County 2024
Why is this Important?
In February of 2024, the Santa Cruz County Board of Supervisors approved a resolution supporting the Convention on the Elimination of All Forms of Discrimination Against Women (CEDAW). This decision was strongly backed by the Santa Cruz County Women's Commission who has concerns about the limited availability of public data sets for conducting intersectional analysis. The commission emphasized the importance of data that considers various factors like gender, race, and geographic location to examine disparities across the county and identify opportunities for targeted intervention. DataShare will be working with the Women's Commission over the course of Spring 2024 to address data gaps in six categories identified by the California Women's Commission - Status of Women and Girls; Healthcare, Economic Empowerment & Justice (including a focus on the impact of childcare costs and available resources for economic opportunity & advancement), Education, Violence Against Women, Criminal Justice and Political Participation.
The goal of this spotlight is to start a conversation about some key data we have available now to assist in advancing gender equity goals in Santa Cruz County. The data is broken out to highlight disparities among women when available and statistically stable (by race/ethnicity, age, gender identity, disability status, geographic regions, etc).
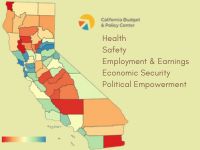
Click on a Region on the Map for more information on the following demographic data:
- Age
- Education
- Employment
- Households/Income
- Population
- Race/Ethnicity
- Sex

Economic Justice
Data for economic justice for women can include income and earnings, business-ownership, poverty rates, homelessness and unhoused data, labour market participation and caregiving statistics. Learn more at Facts & FIgures: Women's Economic Empowerment. See below for data highlights and a dashboard of available indicators.
Economic Justice
Santa Cruz County Gender Pay Gap Disparity
Santa Cruz County's gender pay gap is wider than state and national averages. Women earn 35% less than men in the same roles, highlighting a persistent disparity despite efforts to close the gap. (This is within the context of the national gender pay gap and the Equal Pay Act.)
Hover over or click on icons to the right for further information.
Gender Pay Gap


County: Santa Cruz
Child Care
Having good child care helps kids grow up healthy and learn well. It's important for parents to have child care that they can afford and trust. This way, parents can focus on important things like having a home, food, and healthcare. When child care is affordable, parents can also go to school or work, which can make life better for the whole family (County Health Rankings).
Child Care
Costs in Santa Cruz County Outpace State
Child care costs in Santa Cruz County exceed both California's average and most counties within the state. This cost has risen statistically over time, highlighting a concerning upward trend. Average annual costs of childcare for infants were at an all-time high of $20,061 in 2021, the last available date of measure.
Hover or click on icons to the right for more information.
Average Annual Cost of Child Care for an Infant in a Child Care Center


County: Santa Cruz
Health
Utilizing appropriate clinical and preventative services in a timely fashion can have important implications on the progression and treatment of many diseases. Individuals who receive services in a timely manner have greater opportunity to prevent disease or detect disease during earlier, treatable stages. A delay of necessary care can lead to an increased risk of complications.
The Healthy People 2030 National Health Target is to reduce the proportion of persons who are unable to obtain or delayed in obtaining necessary medical care to 5.9 percent.
Santa Cruz County
Healthcare Access Disparity
This indicator shows the percentage of people who report having delayed or not receiving other medical care they felt they needed. Santa Cruz County residents face greater challenges getting healthcare compared to the state average (16.5%). Over 21% of adults report having delayed or had difficulty obtaining needed care. This problem seems to be getting worse over time.
People Delayed or had Difficulty Obtaining Care
County: Santa Cruz
25.5% of women are likely to experience delay or difficulties in obtaining care, this is slightly higher than the overall value (21%) and than men (17.7%). However, the difference isn't statistically significant yet.
 No significant difference with the overall value
The data also suggests that Hispanic/Latino residents face higher barriers to care (24.2%). This is higher than the county average and the rate for white, non-Hispanic residents (20%).
The information for Asian, non-Hispanic residents is unreliable due to a small sample size. We recommend further research to understand the experiences of groups underrepresented in past data collection. For more details, see the female population size by race/ethnicity in Santa Cruz County,
No significant difference with the overall value
Political Empowerment
Voting is essential in democracy to ensure representation, but barriers like complex registration and unfair laws discourage many eligible voters, especially minorities. This has historically lead to their needs being overlooked. To address this, many groups advocate for simplified registration, expansion of voting options, restoration of voting rights to former prisoners, and improvement of education on voting. Political behavior also shapes societal perceptions of gender characteristics.
Voter engagement
Higher Rates of Voting in Santa Cruz County
A large portion of adults in Santa Cruz County, 74.5%, report frequently voting in national, state and local elections. This percentage is higher than most other counties in California and the statewide average (69%).
Voter Engagement


County: Santa Cruz
Women in Santa Cruz County engage with voting 75% of the time, this is slightly higher than the overall value but not enough to be statistically significant.
No significant difference with the overall value
Local Analysis: Reports & Publications & More Data
Take a look at the detailed information, analysis, and documents about gender fairness goals, progress, and obstacles provided below. To learn more about women's wellbeing through data points, you can explore our population health data with gender breakouts specifically for Santa Cruz County.