Indicator Gauge Icon Legend
Legend Colors
Red is bad, green is good, blue is not statistically different/neutral.
Compared to Distribution
 the value is in the best half of communities.
 the value is in the 2nd worst quarter of communities.
 the value is in the worst quarter of communities.
Compared to Target
 meets target;
  does not meet target.
Compared to a Single Value
 lower than the comparison value;
 higher than the comparison value;
 not statistically different from comparison value.
Trend

 non-significant change over time;
 significant change over time;
  no change over time.
Compared to Prior Value
 higher than the previous measurement period;
 lower than the previous measurement period;
 no statistically different change from previous measurement period.
 Significantly better than the overall value
 Significantly worse than the overall value
 No significant difference with the overall value
 No data on significance available
Children in Working Families who Do Not Have Licensed Child Care Slots Available
Measurement Period: 2021
This indicator is archived and is no longer being updated. Click to learn more
The estimated percentage of children (ages 0-12) with parents in the labor force for whom licensed child care spaces are not available.
Why is this important?
Research findings firmly establish that 90% of a child's brain development occurs before age five and that a quality early education sets the foundation for future success. Quality early education in a child's life promotes educational success, reduces crime, and fosters workforce productivity. School readiness investments result in higher percentages of children reading at grade level, higher graduation rates, fewer remedial services, and higher percentages of young adults prepared to be successful members of the workforce. In addition, there are direct and immediate benefits related to early learning investment - parents are able to work and maintain employment, are less reliant on government resources and overall are more economically self-sufficient. The school readiness program not only reduces public assistance payments and state unemployment and underemployment, but also increases state tax collections and economic productivity.
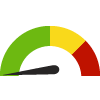
63.7%
Source:
California Child Care Resource & Referral Network
Measurement period: 2021
Maintained by: Conduent Healthy Communities Institute
Last update: March 2023
Measurement period: 2021
Maintained by: Conduent Healthy Communities Institute
Last update: March 2023
Filter(s) for this location: State: California
Compared to
Graph Selections

Data Source
- California Child Care Resource & Referral Network
Maintained By: Conduent Healthy Communities Institute (Methodology)
Filed under: Education / Childcare & Early Childhood Education, Children