Indicator Gauge Icon Legend
Legend Colors
Red is bad, green is good, blue is not statistically different/neutral.
Compared to Distribution
 the value is in the best half of communities.
 the value is in the 2nd worst quarter of communities.
 the value is in the worst quarter of communities.
Compared to Target
 meets target;
  does not meet target.
Compared to a Single Value
 lower than the comparison value;
 higher than the comparison value;
 not statistically different from comparison value.
Trend

 non-significant change over time;
 significant change over time;
  no change over time.
Compared to Prior Value
 higher than the previous measurement period;
 lower than the previous measurement period;
 no statistically different change from previous measurement period.
 Significantly better than the overall value
 Significantly worse than the overall value
 No significant difference with the overall value
 No data on significance available
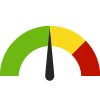
Expulsion Rate
Measurement Period: 2022-2023
This indicator is archived and is no longer being updated. Click to learn more
This indicator shows students (grades K-12) who were expelled from school.
Why is this important?
Expulsions are a form of severe disciplinary action that results in permanent removal of a student from their regular educational setting. Expulsions generally occur when a student violates serious school rules or policies. When a student is expelled, schools may not be obligated to continue working with the student, which may keep the student from receiving needed educational or counseling services. Data suggests that students who are expelled are more likely to be involved in the juvenile justice system, drop out of high school, and earn considerably less over the course of their career than students who were never expelled. Effective strategies for reducing expulsion rates in school include: early intervention for preschool children, early identification of and intervention strategies for children at risk for school difficulties, and annual implementation of age-appropriate codes of conducts.
0.1%
percent of students
Source:
California Department of Education
Measurement period: 2022-2023
Maintained by: Conduent Healthy Communities Institute
Last update: March 2024
Measurement period: 2022-2023
Maintained by: Conduent Healthy Communities Institute
Last update: March 2024
Filter(s) for this location: State: California
Compared to

Graph Selections

Data Source
- California Department of Education
Maintained By: Conduent Healthy Communities Institute (Methodology)
Filed under: Education / School Environment