Advanced Search: Build a Custom Dashboard
In the fields below, search for indicators by location, topics, population, classification, subgroup, or comparison. No fields are required, but we suggest selecting a location or two to start. In the additional search options section, select options to group and order search results. To learn more about how to customize a dashboard, see our help center.
Visit the Indicator List Page to see the full list of indicators and locations available on the site.
Search Results:
Indicator Gauge Icon Legend
Legend Colors
Red is bad, green is good, blue is not statistically different/neutral.
Compared to Distribution
 the value is in the best half of communities.
 the value is in the 2nd worst quarter of communities.
 the value is in the worst quarter of communities.
Compared to Target
 meets target;
  does not meet target.
Compared to a Single Value
 lower than the comparison value;
 higher than the comparison value;
 not statistically different from comparison value.
Trend

 non-significant change over time;
 significant change over time;
  no change over time.
Compared to Prior Value
 higher than the previous measurement period;
 lower than the previous measurement period;
 no statistically different change from previous measurement period.
Community / Transportation
Community / Transportation
County: Santa Cruz
Value
Compared to:
County: Santa Cruz Mean Travel Time to Work
County: Santa Cruz Mean Travel Time to Work
26.7
Minutes
(2018-2022)
Compared to:
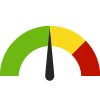


CA Counties
The distribution is based on data from 58 California counties.
U.S. Counties
The distribution is based on data from 3,131 U.S. counties and county equivalents.
CA Value
(29.2)
The regional value is compared to the California state value.
US Value
(26.7)
The regional value is compared to the national value.
Trend
This comparison measures the indicator’s values over multiple time periods.<br>The Mann-Kendall Test for Statistical Significance is used to evaluate the trend<br>over 4 to 10 periods of measure, subject to data availability and comparability.
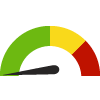
County: Santa Cruz Solo Drivers with a Long Commute
County: Santa Cruz Solo Drivers with a Long Commute
37.4%
(2018-2022)
Compared to:


CA Counties
The distribution is based on data from 58 California counties.
U.S. Counties
The distribution is based on data from 3,141 U.S. counties and county equivalents.
CA Value
(41.6%)
The regional value is compared to the California state value.
US Value
(36.4%)
The regional value is compared to the national value.
Prior Value
(38.0%)
Prior Value compares a measured value with the previously measured value. Confidence intervals were taken into account in determining the direction of the comparison.
Trend
This comparison measures the indicator’s values over multiple time periods.<br>The Mann-Kendall Test for Statistical Significance is used to evaluate the trend<br>over 4 to 10 periods of measure, subject to data availability and comparability.
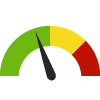
County: Santa Cruz Workers who Drive Alone to Work
County: Santa Cruz Workers who Drive Alone to Work
64.2%
(2018-2022)
Compared to:
CA Counties
The distribution is based on data from 58 California counties.
U.S. Counties
The distribution is based on data from 3,133 U.S. counties and county equivalents.
CA Value
(68.4%)
The regional value is compared to the California state value.
US Value
(71.7%)
The regional value is compared to the national value.
Trend
This comparison measures the indicator’s values over multiple time periods.<br>The Mann-Kendall Test for Statistical Significance is used to evaluate the trend<br>over 4 to 10 periods of measure, subject to data availability and comparability.
Economy / Housing & Homes
Economy / Housing & Homes
County: Santa Cruz
Value
Compared to:
County: Santa Cruz Community Spending on Housing
County: Santa Cruz Community Spending on Housing
33.8%
(2023)
Compared to:


CA Value
(34.1%)
The regional value is compared to the California state value.
US Value
(32.1%)
The regional value is compared to the national value.
Prior Value
(33.8%)
Prior Value compares a measured value with the previously measured value. Confidence intervals were not taken into account in determining the direction of the comparison.
County: Santa Cruz Home Renter Spending-to-Income Ratio
County: Santa Cruz Home Renter Spending-to-Income Ratio
18.9%
(2023)
Compared to:


CA Counties
The distribution is based on data from 58 California counties.
U.S. Counties
The distribution is based on data from 3,141 U.S. counties and county equivalents.
CA Value
(20.7%)
The regional value is compared to the California state value.
Prior Value
(18.7%)
Prior Value compares a measured value with the previously measured value. Confidence intervals were not taken into account in determining the direction of the comparison.
County: Santa Cruz Homeowner Spending-to-Income Ratio
County: Santa Cruz Homeowner Spending-to-Income Ratio
13.8%
(2023)
Compared to:
CA Counties
The distribution is based on data from 58 California counties.
U.S. Counties
The distribution is based on data from 3,141 U.S. counties and county equivalents.
CA Value
(14.4%)
The regional value is compared to the California state value.
Prior Value
(13.6%)
Prior Value compares a measured value with the previously measured value. Confidence intervals were not taken into account in determining the direction of the comparison.
County: Santa Cruz Homeownership
County: Santa Cruz Homeownership
54.4%
(2018-2022)
Compared to:

CA Counties
The distribution is based on data from 58 California counties.
U.S. Counties
The distribution is based on data from 3,133 U.S. counties and county equivalents.
CA Value
(51.4%)
The regional value is compared to the California state value.
US Value
(57.8%)
The regional value is compared to the national value.
Trend
This comparison measures the indicator’s values over multiple time periods.<br>The Mann-Kendall Test for Statistical Significance is used to evaluate the trend<br>over 4 to 10 periods of measure, subject to data availability and comparability.
County: Santa Cruz Overcrowded Households
County: Santa Cruz Overcrowded Households
6.8%
(2018-2022)
Compared to:
CA Counties
The distribution is based on data from 58 California counties.
CA Value
(8.2%)
The regional value is compared to the California state value.
US Value
(3.4%)
The regional value is compared to the national value.
Trend
This comparison measures the indicator’s values over multiple time periods.<br>The Mann-Kendall Test for Statistical Significance is used to evaluate the trend<br>over 4 to 10 periods of measure, subject to data availability and comparability.
County: Santa Cruz Renters Spending 30% or More of Household Income on Rent
County: Santa Cruz Renters Spending 30% or More of Household Income on Rent
52.7%
(2018-2022)
Compared to:
CA Counties
The distribution is based on data from 58 California counties.
U.S. Counties
The distribution is based on data from 3,132 U.S. counties and county equivalents.
CA Value
(54.4%)
The regional value is compared to the California state value.
US Value
(49.9%)
The regional value is compared to the national value.
Trend
This comparison measures the indicator’s values over multiple time periods.<br>The Mann-Kendall Test for Statistical Significance is used to evaluate the trend<br>over 4 to 10 periods of measure, subject to data availability and comparability.
HP 2030 Target
(25.5%)
County: Santa Cruz Severe Housing Problems
County: Santa Cruz Severe Housing Problems
25.6%
(2016-2020)
Compared to:

CA Counties
The distribution is based on data from 58 California counties.
U.S. Counties
The distribution is based on data from 3,141 U.S. counties and county equivalents.
CA Value
(25.7%)
The regional value is compared to the California state value.
US Value
(16.7%)
The regional value is compared to the national value.
Prior Value
(26.5%)
Prior Value compares a measured value with the previously measured value. Confidence intervals were taken into account in determining the direction of the comparison.
Trend
This comparison measures the indicator’s values over multiple time periods.<br>The Mann-Kendall Test for Statistical Significance is used to evaluate the trend<br>over 4 to 10 periods of measure, subject to data availability and comparability.
