Advanced Search: Build a Custom Dashboard
In the fields below, search for indicators by location, topics, population, classification, subgroup, or comparison. No fields are required, but we suggest selecting a location or two to start. In the additional search options section, select options to group and order search results. To learn more about how to customize a dashboard, see our help center.
Visit the Indicator List Page to see the full list of indicators and locations available on the site.
Search Results:
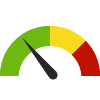
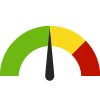
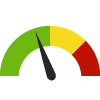
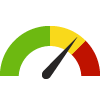
Indicator Gauge Icon Legend
Legend Colors
Red is bad, green is good, blue is not statistically different/neutral.
Compared to Distribution
 the value is in the best half of communities.
 the value is in the 2nd worst quarter of communities.
 the value is in the worst quarter of communities.
Compared to Target
 meets target;
  does not meet target.
Compared to a Single Value
 lower than the comparison value;
 higher than the comparison value;
 not statistically different from comparison value.
Trend

 non-significant change over time;
 significant change over time;
  no change over time.
Compared to Prior Value
 higher than the previous measurement period;
 lower than the previous measurement period;
 no statistically different change from previous measurement period.
Health / Family Planning
Health / Family Planning
County: Santa Cruz
Value
Compared to:
County: Santa Cruz Teen Birth Rate: 15-19
County: Santa Cruz Teen Birth Rate: 15-19
6.3
Live births per 1,000 females aged 15-19
(2019-2021)
Compared to:
CA Counties
The distribution is based on data from 55 California counties.
CA Value
(10.3)
The regional value is compared to the California state value.
US Value
(13.9 in 2021)
The regional value is compared to the national value. The source for the national value is Centers for Disease Control and Prevention, National Center for Health Statistics
Prior Value
(7.1)
Prior Value compares a measured value with the previously measured value. Confidence intervals were taken into account in determining the direction of the comparison.
Trend
This comparison measures the indicator’s values over multiple time periods.<br>The Mann-Kendall Test for Statistical Significance is used to evaluate the trend<br>over 4 to 10 periods of measure, subject to data availability and comparability.
Health / Sexually Transmitted Infections
Health / Sexually Transmitted Infections
County: Santa Cruz
Value
Compared to:
County: Santa Cruz Chlamydia Incidence Rate
County: Santa Cruz Chlamydia Incidence Rate
318.8
Cases per 100,000 population
(2021)
Compared to:


CA Counties
The distribution is based on data from 58 California counties.
CA Value
(484.7)
The regional value is compared to the California state value.
US Value
(495.5)
The regional value is compared to the national value. The source for the national value is National Center for HIV/AIDS, Viral Hepatitis, STD, and TB Prevention
Prior Value
(277.3)
Prior Value compares a measured value with the previously measured value. Confidence intervals were not taken into account in determining the direction of the comparison.
Trend
This comparison measures the indicator’s values over multiple time periods.<br>The Mann-Kendall Test for Statistical Significance is used to evaluate the trend<br>over 4 to 10 periods of measure, subject to data availability and comparability.
County: Santa Cruz Congenital Syphilis Incidence Rate
County: Santa Cruz Congenital Syphilis Incidence Rate
91.6
Cases per 100,000 live births
(2020)
Compared to:

CA Counties
The distribution is based on data from 58 California counties.
CA Value
(114.9)
The regional value is compared to the California state value.
Prior Value
(83.5)
Prior Value compares a measured value with the previously measured value. Confidence intervals were not taken into account in determining the direction of the comparison.
Trend
This comparison measures the indicator’s values over multiple time periods.<br>The Mann-Kendall Test for Statistical Significance is used to evaluate the trend<br>over 4 to 10 periods of measure, subject to data availability and comparability.
HP 2030 Target
(33.9)
County: Santa Cruz Death Rate Among Persons with Diagnosed HIV Infection
County: Santa Cruz Death Rate Among Persons with Diagnosed HIV Infection
1.8
Deaths per 100,000 population
(2022)
Compared to:
CA Counties
The distribution is based on data from 58 California counties.
CA Value
(5.4)
The regional value is compared to the California state value.
Prior Value
(1.5)
Prior Value compares a measured value with the previously measured value. Confidence intervals were not taken into account in determining the direction of the comparison.
Trend
This comparison measures the indicator’s values over multiple time periods.<br>The Mann-Kendall Test for Statistical Significance is used to evaluate the trend<br>over 4 to 10 periods of measure, subject to data availability and comparability.
County: Santa Cruz Gonorrhea Incidence Rate
County: Santa Cruz Gonorrhea Incidence Rate
112.5
Cases per 100,000 population
(2021)
Compared to:
CA Counties
The distribution is based on data from 58 California counties.
CA Value
(230.9)
The regional value is compared to the California state value.
US Value
(214.0)
The regional value is compared to the national value. The source for the national value is National Center for HIV/AIDS, Viral Hepatitis, STD, and TB Prevention
Prior Value
(78.1)
Prior Value compares a measured value with the previously measured value. Confidence intervals were not taken into account in determining the direction of the comparison.
Trend
This comparison measures the indicator’s values over multiple time periods.<br>The Mann-Kendall Test for Statistical Significance is used to evaluate the trend<br>over 4 to 10 periods of measure, subject to data availability and comparability.
County: Santa Cruz HIV Diagnosis Rate
County: Santa Cruz HIV Diagnosis Rate
7.6
Cases per 100,000 population
(2022)
Compared to:
CA Counties
The distribution is based on data from 58 California counties.
CA Value
(12.2)
The regional value is compared to the California state value.
Prior Value
(6.5)
Prior Value compares a measured value with the previously measured value. Confidence intervals were not taken into account in determining the direction of the comparison.
Trend
This comparison measures the indicator’s values over multiple time periods.<br>The Mann-Kendall Test for Statistical Significance is used to evaluate the trend<br>over 4 to 10 periods of measure, subject to data availability and comparability.
County: Santa Cruz HIV/AIDS Prevalence Rate: 13+
County: Santa Cruz HIV/AIDS Prevalence Rate: 13+
230.8
Cases per 100,000 population
(2018-2020)
Compared to:


CA Value
(414.1)
The regional value is compared to the California state value.
Prior Value
(225.0)
Prior Value compares a measured value with the previously measured value. Confidence intervals were taken into account in determining the direction of the comparison.
Trend
This comparison measures the indicator’s values over multiple time periods.<br>The Mann-Kendall Test for Statistical Significance is used to evaluate the trend<br>over 4 to 10 periods of measure, subject to data availability and comparability.
County: Santa Cruz Persons Living and Diagnosed with HIV who are in Care
County: Santa Cruz Persons Living and Diagnosed with HIV who are in Care
76.4%
(2022)
Compared to:


CA Counties
The distribution is based on data from 56 California counties.
CA Value
(73.7%)
The regional value is compared to the California state value.
Prior Value
(76.9%)
Prior Value compares a measured value with the previously measured value. Confidence intervals were not taken into account in determining the direction of the comparison.
Trend
This comparison measures the indicator’s values over multiple time periods.<br>The Mann-Kendall Test for Statistical Significance is used to evaluate the trend<br>over 4 to 10 periods of measure, subject to data availability and comparability.
County: Santa Cruz Persons Living with HIV Rate
County: Santa Cruz Persons Living with HIV Rate
201.4
Cases per 100,000 population
(2022)
Compared to:

CA Value
(355.6)
The regional value is compared to the California state value.
Prior Value
(473.9)
Prior Value compares a measured value with the previously measured value. Confidence intervals were not taken into account in determining the direction of the comparison.
Trend
This comparison measures the indicator’s values over multiple time periods.<br>The Mann-Kendall Test for Statistical Significance is used to evaluate the trend<br>over 4 to 10 periods of measure, subject to data availability and comparability.
County: Santa Cruz Syphilis Incidence Rate
County: Santa Cruz Syphilis Incidence Rate
24.7
Cases per 100,000 population
(2021)
Compared to:

CA Counties
The distribution is based on data from 58 California counties.
CA Value
(22.3)
The regional value is compared to the California state value.
US Value
(16.2)
The regional value is compared to the national value. The source for the national value is National Center for HIV/AIDS, Viral Hepatitis, STD, and TB Prevention
Prior Value
(13.3)
Prior Value compares a measured value with the previously measured value. Confidence intervals were not taken into account in determining the direction of the comparison.
Trend
This comparison measures the indicator’s values over multiple time periods.<br>The Mann-Kendall Test for Statistical Significance is used to evaluate the trend<br>over 4 to 10 periods of measure, subject to data availability and comparability.
