Advanced Search: Build a Custom Dashboard
In the fields below, search for indicators by location, topics, population, classification, subgroup, or comparison. No fields are required, but we suggest selecting a location or two to start. In the additional search options section, select options to group and order search results. To learn more about how to customize a dashboard, see our help center.
Visit the Indicator List Page to see the full list of indicators and locations available on the site.
Search Results:
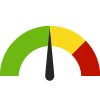
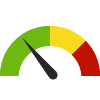
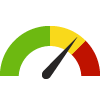
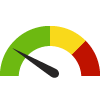
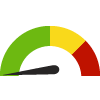
Indicator Gauge Icon Legend
Legend Colors
Red is bad, green is good, blue is not statistically different/neutral.
Compared to Distribution
 the value is in the best half of communities.
 the value is in the 2nd worst quarter of communities.
 the value is in the worst quarter of communities.
Compared to Target
 meets target;
  does not meet target.
Compared to a Single Value
 lower than the comparison value;
 higher than the comparison value;
 not statistically different from comparison value.
Trend

 non-significant change over time;
 significant change over time;
  no change over time.
Compared to Prior Value
 higher than the previous measurement period;
 lower than the previous measurement period;
 no statistically different change from previous measurement period.
Health / Alcohol & Drug Use
Health / Alcohol & Drug Use
County: Santa Cruz
Value
Compared to:
28.0
Rate per 100,000 residents
(2022)
Compared to:


CA Counties
The distribution is based on data from 58 California counties.
CA Value
(16.7)
The regional value is compared to the California state value.
Prior Value
(10.6)
Prior Value compares a measured value with the previously measured value. Confidence intervals were not taken into account in determining the direction of the comparison.
Trend
This comparison measures the indicator’s values over multiple time periods.<br>The Mann-Kendall Test for Statistical Significance is used to evaluate the trend<br>over 4 to 10 periods of measure, subject to data availability and comparability.
HP 2030 Target
(8.9)
<div>IVP-22: Reduce overdose deaths involving synthetic opioids other than methadone</div>
Health / Disabilities
Health / Disabilities
County: Santa Cruz
Value
Compared to:
County: Santa Cruz Children with a Disability
County: Santa Cruz Children with a Disability
5.3%
(2018-2022)
Compared to:


CA Value
(3.7%)
The regional value is compared to the California state value.
US Value
(4.5%)
The regional value is compared to the national value.
Trend
This comparison measures the indicator’s values over multiple time periods.<br>The Mann-Kendall Test for Statistical Significance is used to evaluate the trend<br>over 4 to 10 periods of measure, subject to data availability and comparability.
Health / Health Care Access & Quality
Health / Health Care Access & Quality
County: Santa Cruz
Value
Compared to:
County: Santa Cruz People with a Usual Source of Health Care
County: Santa Cruz People with a Usual Source of Health Care
84.5%
(2022)
Compared to:

CA Counties
The distribution is based on data from 58 California counties.
CA Value
(82.5%)
The regional value is compared to the California state value.
Prior Value
(88.0%)
Prior Value compares a measured value with the previously measured value. Confidence intervals were taken into account in determining the direction of the comparison.
Trend
This comparison measures the indicator’s values over multiple time periods.<br>The Mann-Kendall Test for Statistical Significance is used to evaluate the trend<br>over 4 to 10 periods of measure, subject to data availability and comparability.
County: Santa Cruz Persons with Health Insurance
County: Santa Cruz Persons with Health Insurance
92.3%
(2021)
Compared to:
CA Counties
The distribution is based on data from 58 California counties.
U.S. Counties
The distribution is based on data from 3,140 U.S. counties and county equivalents.
CA Value
(91.9%)
The regional value is compared to the California state value.
Prior Value
(92.0%)
Prior Value compares a measured value with the previously measured value. Confidence intervals were taken into account in determining the direction of the comparison.
Trend
This comparison measures the indicator’s values over multiple time periods.<br>The Mann-Kendall Test for Statistical Significance is used to evaluate the trend<br>over 4 to 10 periods of measure, subject to data availability and comparability.
HP 2030 Target
(92.4%)
<div>AHS-01: Increase the proportion of people with health insurance <strong>(LEADING HEALTH INDICATOR)</strong></div>
Health / Immunizations & Infectious Diseases
Health / Immunizations & Infectious Diseases
County: Santa Cruz
Value
Compared to:
County: Santa Cruz Kindergartners with Required Immunizations
County: Santa Cruz Kindergartners with Required Immunizations
91.1%
(2021-2022)
Compared to:

CA Counties
The distribution is based on data from 56 California counties.
CA Value
(92.8%)
The regional value is compared to the California state value.
Prior Value
(88.8%)
Prior Value compares a measured value with the previously measured value. Confidence intervals were not taken into account in determining the direction of the comparison.
Trend
This comparison measures the indicator’s values over multiple time periods.<br>The Mann-Kendall Test for Statistical Significance is used to evaluate the trend<br>over 4 to 10 periods of measure, subject to data availability and comparability.
Health / Mental Health & Mental Disorders
Health / Mental Health & Mental Disorders
County: Santa Cruz
Value
Compared to:
County: Santa Cruz Students Seriously Considering Suicide
County: Santa Cruz Students Seriously Considering Suicide
14.0%
Percent (%)
(2021)
Compared to:
Prior Value
(14.0%)
Prior Value compares a measured value with the previously measured value. Confidence intervals were not taken into account in determining the direction of the comparison.
Trend
This comparison measures the indicator’s values over multiple time periods.<br>The Mann-Kendall Test for Statistical Significance is used to evaluate the trend<br>over 4 to 10 periods of measure, subject to data availability and comparability.
Community
Community
County: Santa Cruz
Value
Compared to:
County: Santa Cruz Student Connectedness: 5th Graders
County: Santa Cruz Student Connectedness: 5th Graders
250
Students
(2021)
Compared to:
Prior Value
(71)
Prior Value compares a measured value with the previously measured value. Confidence intervals were not taken into account in determining the direction of the comparison.
Trend
This comparison measures the indicator’s values over multiple time periods.<br>The Mann-Kendall Test for Statistical Significance is used to evaluate the trend<br>over 4 to 10 periods of measure, subject to data availability and comparability.
Community / Domestic Violence & Abuse
Community / Domestic Violence & Abuse
County: Santa Cruz
Value
Compared to:
County: Santa Cruz Domestic Violence Calls
County: Santa Cruz Domestic Violence Calls
4.8
Calls per 1,000 population 18-69
(2022)
Compared to:

CA Value
(6.4)
The regional value is compared to the California state value.
Prior Value
(5.1)
Prior Value compares a measured value with the previously measured value. Confidence intervals were not taken into account in determining the direction of the comparison.
Trend
This comparison measures the indicator’s values over multiple time periods.<br>The Mann-Kendall Test for Statistical Significance is used to evaluate the trend<br>over 4 to 10 periods of measure, subject to data availability and comparability.
Economy / Food Insecurity
Economy / Food Insecurity
County: Santa Cruz
Value
Compared to:
County: Santa Cruz Child Food Insecurity Rate
County: Santa Cruz Child Food Insecurity Rate
10.3%
(2021)
Compared to:
CA Counties
The distribution is based on data from 58 California counties.
U.S. Counties
The distribution is based on data from 3,140 U.S. counties and county equivalents.
CA Value
(13.5%)
The regional value is compared to the California state value.
US Value
(12.8%)
The regional value is compared to the national value.
Prior Value
(13.6%)
Prior Value compares a measured value with the previously measured value. Confidence intervals were not taken into account in determining the direction of the comparison.
Trend
This comparison measures the indicator’s values over multiple time periods.<br>The Mann-Kendall Test for Statistical Significance is used to evaluate the trend<br>over 4 to 10 periods of measure, subject to data availability and comparability.
Economy / Homelessness
Economy / Homelessness
County: Santa Cruz
Value
Compared to:
County: Santa Cruz Total Homeless Population
County: Santa Cruz Total Homeless Population
2,299
Persons
(2022)
Compared to:
Prior Value
(800)
Prior Value compares a measured value with the previously measured value. Confidence intervals were not taken into account in determining the direction of the comparison.
Trend
This comparison measures the indicator’s values over multiple time periods.<br>The Mann-Kendall Test for Statistical Significance is used to evaluate the trend<br>over 4 to 10 periods of measure, subject to data availability and comparability.
Economy / Housing & Homes
Economy / Housing & Homes
County: Santa Cruz
Value
Compared to:
County: Santa Cruz Overcrowded Households
County: Santa Cruz Overcrowded Households
6.8%
(2018-2022)
Compared to:
CA Counties
The distribution is based on data from 58 California counties.
CA Value
(8.2%)
The regional value is compared to the California state value.
US Value
(3.4%)
The regional value is compared to the national value.
Trend
This comparison measures the indicator’s values over multiple time periods.<br>The Mann-Kendall Test for Statistical Significance is used to evaluate the trend<br>over 4 to 10 periods of measure, subject to data availability and comparability.
Economy / Poverty
Economy / Poverty
County: Santa Cruz
Value
Compared to:
County: Santa Cruz Families Living Below Poverty Level
County: Santa Cruz Families Living Below Poverty Level
6.2%
(2018-2022)
Compared to:
CA Counties
The distribution is based on data from 58 California counties.
U.S. Counties
The distribution is based on data from 3,104 U.S. counties and county equivalents.
CA Value
(8.5%)
The regional value is compared to the California state value.
US Value
(8.8%)
The regional value is compared to the national value.
Trend
This comparison measures the indicator’s values over multiple time periods.<br>The Mann-Kendall Test for Statistical Significance is used to evaluate the trend<br>over 4 to 10 periods of measure, subject to data availability and comparability.
Education / Childcare & Early Childhood Education
Education / Childcare & Early Childhood Education
County: Santa Cruz
Value
Compared to:
63.7%
(2021)
Compared to:
CA Counties
The distribution is based on data from 57 California counties.
CA Value
(75.2%)
The regional value is compared to the California state value.
Prior Value
(69.9%)
Prior Value compares a measured value with the previously measured value. Confidence intervals were not taken into account in determining the direction of the comparison.
Trend
This comparison measures the indicator’s values over multiple time periods.<br>The Mann-Kendall Test for Statistical Significance is used to evaluate the trend<br>over 4 to 10 periods of measure, subject to data availability and comparability.
