Advanced Search: Build a Custom Dashboard
In the fields below, search for indicators by location, topics, population, classification, subgroup, or comparison. No fields are required, but we suggest selecting a location or two to start. In the additional search options section, select options to group and order search results. To learn more about how to customize a dashboard, see our help center.
Visit the Indicator List Page to see the full list of indicators and locations available on the site.
Search Results:
Indicator Gauge Icon Legend
Legend Colors
Red is bad, green is good, blue is not statistically different/neutral.
Compared to Distribution
 the value is in the best half of communities.
 the value is in the 2nd worst quarter of communities.
 the value is in the worst quarter of communities.
Compared to Target
 meets target;
  does not meet target.
Compared to a Single Value
 lower than the comparison value;
 higher than the comparison value;
 not statistically different from comparison value.
Trend

 non-significant change over time;
 significant change over time;
  no change over time.
Compared to Prior Value
 higher than the previous measurement period;
 lower than the previous measurement period;
 no statistically different change from previous measurement period.
Environmental Health / Weather & Climate
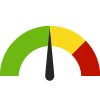
Number of Extreme Precipitation Days County: Santa Cruz
Number of Extreme Precipitation Days County: Santa Cruz
6
Days
(2023)
Compared to:
Prior Value
(8)
Prior Value compares a measured value with the previously measured value. Confidence intervals were not taken into account in determining the direction of the comparison.
Trend
This comparison measures the indicator’s values over multiple time periods.<br>The Mann-Kendall Test for Statistical Significance is used to evaluate the trend<br>over 4 to 10 periods of measure, subject to data availability and comparability.
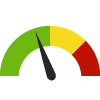
Number of Extreme Heat Events County: Santa Cruz
Number of Extreme Heat Events County: Santa Cruz
9
Events
(2022)
Compared to:

Prior Value
(22)
Prior Value compares a measured value with the previously measured value. Confidence intervals were not taken into account in determining the direction of the comparison.
Trend
This comparison measures the indicator’s values over multiple time periods.<br>The Mann-Kendall Test for Statistical Significance is used to evaluate the trend<br>over 4 to 10 periods of measure, subject to data availability and comparability.
Number of Extreme Heat Days County: Santa Cruz
Number of Extreme Heat Days County: Santa Cruz
14
Days
(2022)
Compared to:
Prior Value
(26)
Prior Value compares a measured value with the previously measured value. Confidence intervals were not taken into account in determining the direction of the comparison.
Trend
This comparison measures the indicator’s values over multiple time periods.<br>The Mann-Kendall Test for Statistical Significance is used to evaluate the trend<br>over 4 to 10 periods of measure, subject to data availability and comparability.
Weeks of Moderate Drought or Worse County: Santa Cruz
Weeks of Moderate Drought or Worse County: Santa Cruz
38
Weeks per year
(2021)
Compared to:

Prior Value
(24)
Prior Value compares a measured value with the previously measured value. Confidence intervals were not taken into account in determining the direction of the comparison.
Trend
This comparison measures the indicator’s values over multiple time periods.<br>The Mann-Kendall Test for Statistical Significance is used to evaluate the trend<br>over 4 to 10 periods of measure, subject to data availability and comparability.
Health / Heart Disease & Stroke
Age-Adjusted Death Rate due to Heart Attack County: Santa Cruz
Age-Adjusted Death Rate due to Heart Attack County: Santa Cruz
31.0
Deaths per 100,000 population 35+ years
(2021)
Compared to:

CA Counties
The distribution is based on data from 58 California counties.
CA Value
(44.3)
The regional value is compared to the California state value.
Prior Value
(27.0)
Prior Value compares a measured value with the previously measured value. Confidence intervals were not taken into account in determining the direction of the comparison.
Trend
This comparison measures the indicator’s values over multiple time periods.<br>The Mann-Kendall Test for Statistical Significance is used to evaluate the trend<br>over 4 to 10 periods of measure, subject to data availability and comparability.
Health / Heart Disease & Stroke
Age-Adjusted Hospitalization Rate due to Heart Attack
Value
Compared to:
Age-Adjusted Hospitalization Rate due to Heart Attack County: Santa Cruz
Age-Adjusted Hospitalization Rate due to Heart Attack County: Santa Cruz
15.9
Hospitalizations per 10,000 population 35+ years
(2020)
Compared to:
CA Counties
The distribution is based on data from 58 California counties.
CA Value
(21.1)
The regional value is compared to the California state value.
Prior Value
(19.3)
Prior Value compares a measured value with the previously measured value. Confidence intervals were not taken into account in determining the direction of the comparison.
Trend
This comparison measures the indicator’s values over multiple time periods.<br>The Mann-Kendall Test for Statistical Significance is used to evaluate the trend<br>over 4 to 10 periods of measure, subject to data availability and comparability.
Environmental Health / Built Environment
Access to Parks County: Santa Cruz
Access to Parks County: Santa Cruz
0.9%
(2020)
Compared to:

CA Counties
The distribution is based on data from 58 California counties.
CA Value
(79.5%)
The regional value is compared to the California state value.
Prior Value
(0.8%)
Prior Value compares a measured value with the previously measured value. Confidence intervals were not taken into account in determining the direction of the comparison.
Proximity to Highways County: Santa Cruz
Proximity to Highways County: Santa Cruz
0.0%
(2020)
Compared to:
CA Value
(0.1%)
The regional value is compared to the California state value.
Prior Value
(0.0%)
Prior Value compares a measured value with the previously measured value. Confidence intervals were not taken into account in determining the direction of the comparison.
Health / Family Planning
Teen Birth Rate: 15-19 County: Santa Cruz
Teen Birth Rate: 15-19 County: Santa Cruz
6.3
Live births per 1,000 females aged 15-19
(2019-2021)
Compared to:

CA Counties
The distribution is based on data from 55 California counties.
CA Value
(10.3)
The regional value is compared to the California state value.
US Value
(13.9 in 2021)
The regional value is compared to the national value. The source for the national value is Centers for Disease Control and Prevention, National Center for Health Statistics
Prior Value
(7.1)
Prior Value compares a measured value with the previously measured value. Confidence intervals were taken into account in determining the direction of the comparison.
Trend
This comparison measures the indicator’s values over multiple time periods.<br>The Mann-Kendall Test for Statistical Significance is used to evaluate the trend<br>over 4 to 10 periods of measure, subject to data availability and comparability.
Health / Maternal, Fetal & Infant Health
Babies with Low Birthweight County: Santa Cruz
Babies with Low Birthweight County: Santa Cruz
6.1%
(2020-2022)
Compared to:

CA Counties
The distribution is based on data from 58 California counties.
CA Value
(7.2%)
The regional value is compared to the California state value.
US Value
(8.5% in 2021)
The regional value is compared to the national value. The source for the national value is Centers for Disease Control and Prevention
Prior Value
(5.6%)
Prior Value compares a measured value with the previously measured value. Confidence intervals were taken into account in determining the direction of the comparison.
Trend
This comparison measures the indicator’s values over multiple time periods.<br>The Mann-Kendall Test for Statistical Significance is used to evaluate the trend<br>over 4 to 10 periods of measure, subject to data availability and comparability.
Economy / Employment
Unemployed Workers in Civilian Labor Force County: Santa Cruz
Unemployed Workers in Civilian Labor Force County: Santa Cruz
7.5%
(January 2024)
Compared to:


CA Counties
The distribution is based on data from 58 California counties.
U.S. Counties
The distribution is based on non-seasonally-adjusted data from 3,140 U.S. counties and county equivalents.
CA Value
(5.7%)
The regional value is compared to the California state value.
US Value
(4.1%)
The regional value is compared to the national value.
Prior Value
(6.7%)
Prior Value compares a measured value with the previously measured value. Confidence intervals were not taken into account in determining the direction of the comparison.
Trend
This comparison measures the indicator’s values over multiple time periods.<br>The Mann-Kendall Test for Statistical Significance is used to evaluate the trend<br>over 4 to 10 periods of measure, subject to data availability and comparability.
Unemployed Workers in Civilian Labor Force Census Place: Santa Cruz
Unemployed Workers in Civilian Labor Force Census Place: Santa Cruz
4.9%
(January 2024)
Compared to:

CA Counties
The distribution is based on data from 58 California counties.
U.S. Counties
The distribution is based on non-seasonally-adjusted data from 3,140 U.S. counties and county equivalents.
CA Value
(5.7%)
The regional value is compared to the California state value.
US Value
(4.1%)
The regional value is compared to the national value.
Prior Value
(4.5%)
Prior Value compares a measured value with the previously measured value. Confidence intervals were not taken into account in determining the direction of the comparison.
Trend
This comparison measures the indicator’s values over multiple time periods.<br>The Mann-Kendall Test for Statistical Significance is used to evaluate the trend<br>over 4 to 10 periods of measure, subject to data availability and comparability.
Unemployed Workers in Civilian Labor Force Census Place: Watsonville
Unemployed Workers in Civilian Labor Force Census Place: Watsonville
15.9%
(January 2024)
Compared to:
CA Counties
The distribution is based on data from 58 California counties.
U.S. Counties
The distribution is based on non-seasonally-adjusted data from 3,140 U.S. counties and county equivalents.
CA Value
(5.7%)
The regional value is compared to the California state value.
US Value
(4.1%)
The regional value is compared to the national value.
Prior Value
(14.7%)
Prior Value compares a measured value with the previously measured value. Confidence intervals were not taken into account in determining the direction of the comparison.
Trend
This comparison measures the indicator’s values over multiple time periods.<br>The Mann-Kendall Test for Statistical Significance is used to evaluate the trend<br>over 4 to 10 periods of measure, subject to data availability and comparability.
Size of Labor Force County: Santa Cruz
Size of Labor Force County: Santa Cruz
131,696
Persons
(January 2024)
Compared to:

Prior Value
(131,017)
Prior Value compares a measured value with the previously measured value. Confidence intervals were not taken into account in determining the direction of the comparison.
Trend
This comparison measures the indicator’s values over multiple time periods.<br>The Mann-Kendall Test for Statistical Significance is used to evaluate the trend<br>over 4 to 10 periods of measure, subject to data availability and comparability.
Size of Labor Force Census Place: Watsonville
Size of Labor Force Census Place: Watsonville
24,536
Persons
(January 2024)
Compared to:
Prior Value
(24,258)
Prior Value compares a measured value with the previously measured value. Confidence intervals were not taken into account in determining the direction of the comparison.
Trend
This comparison measures the indicator’s values over multiple time periods.<br>The Mann-Kendall Test for Statistical Significance is used to evaluate the trend<br>over 4 to 10 periods of measure, subject to data availability and comparability.
Size of Labor Force Census Place: Santa Cruz
Size of Labor Force Census Place: Santa Cruz
30,741
Persons
(January 2024)
Compared to:
Prior Value
(30,716)
Prior Value compares a measured value with the previously measured value. Confidence intervals were not taken into account in determining the direction of the comparison.
Trend
This comparison measures the indicator’s values over multiple time periods.<br>The Mann-Kendall Test for Statistical Significance is used to evaluate the trend<br>over 4 to 10 periods of measure, subject to data availability and comparability.
Health / Mental Health & Mental Disorders
Health / Mental Health & Mental Disorders
Individuals Utilizing Behavioral Health Services at the County of Santa Cruz
Value
Compared to:
Individuals Utilizing Behavioral Health Services at the County of Santa Cruz County: Santa Cruz
Individuals Utilizing Behavioral Health Services at the County of Santa Cruz County: Santa Cruz
3,747
People
(2022-2023)
Compared to:


Prior Value
(3,448)
Prior Value compares a measured value with the previously measured value. Confidence intervals were not taken into account in determining the direction of the comparison.
Trend
This comparison measures the indicator’s values over multiple time periods.<br>The Mann-Kendall Test for Statistical Significance is used to evaluate the trend<br>over 4 to 10 periods of measure, subject to data availability and comparability.
Health / Mortality Data
Life Expectancy County: Santa Cruz
Life Expectancy County: Santa Cruz
82.1
Years
(2019-2021)
Compared to:
CA Counties
The distribution is based on data from 57 California counties.
U.S. Counties
The distribution is based on data from 3,070 U.S. counties and county equivalents.
CA Value
(79.9)
The regional value is compared to the California state value.
US Value
(77.6)
The regional value is compared to the national value.
Community / Transportation
Solo Drivers with a Long Commute County: Santa Cruz
Solo Drivers with a Long Commute County: Santa Cruz
37.4%
(2018-2022)
Compared to:
CA Counties
The distribution is based on data from 58 California counties.
U.S. Counties
The distribution is based on data from 3,141 U.S. counties and county equivalents.
CA Value
(41.6%)
The regional value is compared to the California state value.
US Value
(36.4%)
The regional value is compared to the national value.
Prior Value
(38.0%)
Prior Value compares a measured value with the previously measured value. Confidence intervals were taken into account in determining the direction of the comparison.
Trend
This comparison measures the indicator’s values over multiple time periods.<br>The Mann-Kendall Test for Statistical Significance is used to evaluate the trend<br>over 4 to 10 periods of measure, subject to data availability and comparability.
Economy / Housing & Homes
Severe Housing Problems County: Santa Cruz
Severe Housing Problems County: Santa Cruz
25.6%
(2016-2020)
Compared to:
CA Counties
The distribution is based on data from 58 California counties.
U.S. Counties
The distribution is based on data from 3,141 U.S. counties and county equivalents.
CA Value
(25.7%)
The regional value is compared to the California state value.
US Value
(16.7%)
The regional value is compared to the national value.
Prior Value
(26.5%)
Prior Value compares a measured value with the previously measured value. Confidence intervals were taken into account in determining the direction of the comparison.
Trend
This comparison measures the indicator’s values over multiple time periods.<br>The Mann-Kendall Test for Statistical Significance is used to evaluate the trend<br>over 4 to 10 periods of measure, subject to data availability and comparability.
Community / Social Environment
Social Associations County: Santa Cruz
Social Associations County: Santa Cruz
7.5
Membership associations per 10,000 population
(2021)
Compared to:
CA Counties
The distribution is based on data from 58 California counties.
U.S. Counties
The distribution is based on data from 3,141 U.S. counties and county equivalents.
CA Value
(6.0)
The regional value is compared to the California state value.
US Value
(9.1)
The regional value is compared to the national value.
Prior Value
(7.4)
Prior Value compares a measured value with the previously measured value. Confidence intervals were not taken into account in determining the direction of the comparison.
Trend
This comparison measures the indicator’s values over multiple time periods.<br>The Mann-Kendall Test for Statistical Significance is used to evaluate the trend<br>over 4 to 10 periods of measure, subject to data availability and comparability.
Health / Health Care Access & Quality
Primary Care Provider Rate County: Santa Cruz
Primary Care Provider Rate County: Santa Cruz
102
Providers per 100,000 population
(2021)
Compared to:

CA Counties
The distribution is based on data from 57 California counties.
U.S. Counties
The distribution is based on data from 2,984 U.S. counties and county equivalents.
CA Value
(81)
The regional value is compared to the California state value.
Prior Value
(104)
Prior Value compares a measured value with the previously measured value. Confidence intervals were not taken into account in determining the direction of the comparison.
Trend
This comparison measures the indicator’s values over multiple time periods.<br>The Mann-Kendall Test for Statistical Significance is used to evaluate the trend<br>over 4 to 10 periods of measure, subject to data availability and comparability.
Community / Public Safety
Alcohol-Impaired Driving Deaths County: Santa Cruz
Alcohol-Impaired Driving Deaths County: Santa Cruz
30.8%
Percent of driving deaths with alcohol involvement
(2017-2021)
Compared to:
CA Counties
The distribution is based on data from 58 California counties.
U.S. Counties
The distribution is based on data from 3,116 U.S. counties and county equivalents.
CA Value
(26.7%)
The regional value is compared to the California state value.
US Value
(26.3%)
The regional value is compared to the national value.
Prior Value
(30.9%)
Prior Value compares a measured value with the previously measured value. Confidence intervals were taken into account in determining the direction of the comparison.
Trend
This comparison measures the indicator’s values over multiple time periods.<br>The Mann-Kendall Test for Statistical Significance is used to evaluate the trend<br>over 4 to 10 periods of measure, subject to data availability and comparability.
Environmental Health / Built Environment
Access to Exercise Opportunities County: Santa Cruz
Access to Exercise Opportunities County: Santa Cruz
97.7%
(2024)
Compared to:
CA Counties
The distribution is based on data from 58 California counties.
U.S. Counties
The distribution is based on data from 3,096 U.S. counties and county equivalents.
CA Value
(94.2%)
The regional value is compared to the California state value.
US Value
(84.1%)
The regional value is compared to the national value.
Prior Value
(96.8%)
Prior Value compares a measured value with the previously measured value. Confidence intervals were not taken into account in determining the direction of the comparison.
Food Environment Index County: Santa Cruz
Food Environment Index County: Santa Cruz
8.4
(2024)
Compared to:
CA Counties
The distribution is based on data from 58 California counties.
U.S. Counties
The distribution is based on data from 3,108 U.S. counties and county equivalents.
CA Value
(8.6)
The regional value is compared to the California state value.
US Value
(7.7)
The regional value is compared to the national value.
Prior Value
(8.2)
Prior Value compares a measured value with the previously measured value. Confidence intervals were not taken into account in determining the direction of the comparison.
Trend
This comparison measures the indicator’s values over multiple time periods.<br>The Mann-Kendall Test for Statistical Significance is used to evaluate the trend<br>over 4 to 10 periods of measure, subject to data availability and comparability.
Health / Mental Health & Mental Disorders
Health / Mental Health & Mental Disorders
Poor Mental Health: Average Number of Days
Value
Compared to:
Poor Mental Health: Average Number of Days County: Santa Cruz
Poor Mental Health: Average Number of Days County: Santa Cruz
5.2
Days
(2021)
Compared to:
CA Counties
The distribution is based on data from 58 California counties.
U.S. Counties
The distribution is based on data from 3,141 U.S. counties and county equivalents.
CA Value
(4.7)
The regional value is compared to the California state value.
US Value
(4.8)
The regional value is compared to the national value.
Prior Value
(4.6)
Prior Value compares a measured value with the previously measured value. Confidence intervals were taken into account in determining the direction of the comparison.
Trend
This comparison measures the indicator’s values over multiple time periods.<br>The Mann-Kendall Test for Statistical Significance is used to evaluate the trend<br>over 4 to 10 periods of measure, subject to data availability and comparability.
Health / Wellness & Lifestyle
Poor Physical Health: Average Number of Days County: Santa Cruz
Poor Physical Health: Average Number of Days County: Santa Cruz
3.4
Days
(2021)
Compared to:
CA Counties
The distribution is based on data from 58 California counties.
U.S. Counties
The distribution is based on data from 3,141 U.S. counties and county equivalents.
CA Value
(3.1)
The regional value is compared to the California state value.
US Value
(3.3)
The regional value is compared to the national value.
Prior Value
(3.0)
Prior Value compares a measured value with the previously measured value. Confidence intervals were taken into account in determining the direction of the comparison.
Trend
This comparison measures the indicator’s values over multiple time periods.<br>The Mann-Kendall Test for Statistical Significance is used to evaluate the trend<br>over 4 to 10 periods of measure, subject to data availability and comparability.
Health / Health Care Access & Quality
Non-Physician Primary Care Provider Rate County: Santa Cruz
Non-Physician Primary Care Provider Rate County: Santa Cruz
97
Providers per 100,000 population
(2023)
Compared to:
CA Counties
The distribution is based on data from 58 California counties.
U.S. Counties
The distribution is based on data from 3,129 U.S. counties and county equivalents.
CA Value
(87)
The regional value is compared to the California state value.
Prior Value
(90)
Prior Value compares a measured value with the previously measured value. Confidence intervals were not taken into account in determining the direction of the comparison.
Trend
This comparison measures the indicator’s values over multiple time periods.<br>The Mann-Kendall Test for Statistical Significance is used to evaluate the trend<br>over 4 to 10 periods of measure, subject to data availability and comparability.
Health / Alcohol & Drug Use
Death Rate due to Drug Poisoning County: Santa Cruz
Death Rate due to Drug Poisoning County: Santa Cruz
24.3
Deaths per 100,000 population
(2019-2021)
Compared to:
CA Counties
The distribution is based on data from 54 California counties.
U.S. Counties
The distribution is based on data from 1,899 U.S. counties and county equivalents.
CA Value
(22.0)
The regional value is compared to the California state value.
US Value
(27.2)
The regional value is compared to the national value.
HP 2030 Target
(20.7)
<div>SU-03: Reduce drug overdose deaths <strong>(LEADING HEALTH INDICATOR)</strong></div>
Community / Demographics
Residential Segregation - Black/White County: Santa Cruz
Residential Segregation - Black/White County: Santa Cruz
72.8
Score
(2024)
Compared to:

CA Counties
The distribution is based on data from 52 California counties.
U.S. Counties
The distribution is based on data from 2,076 U.S. counties and county equivalents.
CA Value
(58.0)
The regional value is compared to the California state value.
US Value
(62.7)
The regional value is compared to the national value.
Prior Value
(73.5)
Prior Value compares a measured value with the previously measured value. Confidence intervals were not taken into account in determining the direction of the comparison.
Trend
This comparison measures the indicator’s values over multiple time periods.<br>The Mann-Kendall Test for Statistical Significance is used to evaluate the trend<br>over 4 to 10 periods of measure, subject to data availability and comparability.
Health / Mental Health & Mental Disorders
Mental Health Provider Rate County: Santa Cruz
Mental Health Provider Rate County: Santa Cruz
951
Providers per 100,000 population
(2023)
Compared to:
CA Counties
The distribution is based on data from 58 California counties.
U.S. Counties
The distribution is based on data from 2,956 U.S. counties and county equivalents.
CA Value
(450)
The regional value is compared to the California state value.
Prior Value
(914)
Prior Value compares a measured value with the previously measured value. Confidence intervals were not taken into account in determining the direction of the comparison.
Trend
This comparison measures the indicator’s values over multiple time periods.<br>The Mann-Kendall Test for Statistical Significance is used to evaluate the trend<br>over 4 to 10 periods of measure, subject to data availability and comparability.
Health / Oral Health
Dentist Rate County: Santa Cruz
Dentist Rate County: Santa Cruz
90
Dentists per 100,000 population
(2022)
Compared to:
CA Counties
The distribution is based on data from 58 California counties.
U.S. Counties
The distribution is based on data from 3,054 U.S. counties and county equivalents.
CA Value
(93)
The regional value is compared to the California state value.
Prior Value
(86)
Prior Value compares a measured value with the previously measured value. Confidence intervals were not taken into account in determining the direction of the comparison.
Trend
This comparison measures the indicator’s values over multiple time periods.<br>The Mann-Kendall Test for Statistical Significance is used to evaluate the trend<br>over 4 to 10 periods of measure, subject to data availability and comparability.
Health / Maternal, Fetal & Infant Health
Infant Mortality Rate County: Santa Cruz
Infant Mortality Rate County: Santa Cruz
3.8
Deaths per 1,000 live births
(2018-2020)
Compared to:
CA Value
(4.2)
The regional value is compared to the California state value.
US Value
(5.6)
The regional value is compared to the national value. The source for the national value is Centers for Disease Control and Prevention
Prior Value
(3.9)
Prior Value compares a measured value with the previously measured value. Confidence intervals were taken into account in determining the direction of the comparison.
Trend
This comparison measures the indicator’s values over multiple time periods.<br>The Mann-Kendall Test for Statistical Significance is used to evaluate the trend<br>over 4 to 10 periods of measure, subject to data availability and comparability.
HP 2030 Target
(5.0)
<div>MICH-02: Reduce the rate of infant deaths <strong>(LEADING HEALTH INDICATOR)</strong></div>
Economy / Income
Gender Pay Gap Region: San Lorenzo Valley
Gender Pay Gap Region: San Lorenzo Valley
$0.49
Cents on the dollar
(2018-2022)
Compared to:
CA Counties
The distribution is based on data from 58 California counties.
Santa Cruz, CA County Value
($0.65)
The regional value is compared to the Santa Cruz County value.
CA Value
($0.74)
The regional value is compared to the California state value.
US Value
($0.72)
The regional value is compared to the national value.
Gender Pay Gap Region: South County
Gender Pay Gap Region: South County
$0.64
Cents on the dollar
(2018-2022)
Compared to:
CA Counties
The distribution is based on data from 58 California counties.
Santa Cruz, CA County Value
($0.65)
The regional value is compared to the Santa Cruz County value.
CA Value
($0.74)
The regional value is compared to the California state value.
US Value
($0.72)
The regional value is compared to the national value.
Gender Pay Gap Region: North County
Gender Pay Gap Region: North County
$0.70
Cents on the dollar
(2018-2022)
Compared to:
CA Counties
The distribution is based on data from 58 California counties.
Santa Cruz, CA County Value
($0.65)
The regional value is compared to the Santa Cruz County value.
CA Value
($0.74)
The regional value is compared to the California state value.
US Value
($0.72)
The regional value is compared to the national value.
Gender Pay Gap Region: Mid-County
Gender Pay Gap Region: Mid-County
$0.72
Cents on the dollar
(2018-2022)
Compared to:
CA Counties
The distribution is based on data from 58 California counties.
Santa Cruz, CA County Value
($0.65)
The regional value is compared to the Santa Cruz County value.
CA Value
($0.74)
The regional value is compared to the California state value.
US Value
($0.72)
The regional value is compared to the national value.
Education / Educational Attainment
Education / Educational Attainment
High School Graduates Earning a Seal of Biliteracy
Value
Compared to:
High School Graduates Earning a Seal of Biliteracy County: Santa Cruz
High School Graduates Earning a Seal of Biliteracy County: Santa Cruz
229
Students
(2023)
Compared to:
Prior Value
(13)
Prior Value compares a measured value with the previously measured value. Confidence intervals were not taken into account in determining the direction of the comparison.
Trend
This comparison measures the indicator’s values over multiple time periods.<br>The Mann-Kendall Test for Statistical Significance is used to evaluate the trend<br>over 4 to 10 periods of measure, subject to data availability and comparability.
Community / Public Safety
Bicycle-Involved Collision Rate County: Santa Cruz
Bicycle-Involved Collision Rate County: Santa Cruz
0.0
Collisions per 100,000 population
(2023)
Compared to:
CA Counties
(2022)
The distribution is based on data from 58 California counties.
CA Value
(0.3)
The regional value is compared to the California state value.
Prior Value
(61.5)
Prior Value compares a measured value with the previously measured value. Confidence intervals were not taken into account in determining the direction of the comparison.
Trend
This comparison measures the indicator’s values over multiple time periods.<br>The Mann-Kendall Test for Statistical Significance is used to evaluate the trend<br>over 4 to 10 periods of measure, subject to data availability and comparability.
Health / Sexually Transmitted Infections
Health / Sexually Transmitted Infections
Death Rate Among Persons with Diagnosed HIV Infection
Value
Compared to:
Death Rate Among Persons with Diagnosed HIV Infection County: Santa Cruz
Death Rate Among Persons with Diagnosed HIV Infection County: Santa Cruz
1.8
Deaths per 100,000 population
(2022)
Compared to:
CA Counties
The distribution is based on data from 58 California counties.
CA Value
(5.4)
The regional value is compared to the California state value.
Prior Value
(1.5)
Prior Value compares a measured value with the previously measured value. Confidence intervals were not taken into account in determining the direction of the comparison.
Trend
This comparison measures the indicator’s values over multiple time periods.<br>The Mann-Kendall Test for Statistical Significance is used to evaluate the trend<br>over 4 to 10 periods of measure, subject to data availability and comparability.
HIV Diagnosis Rate County: Santa Cruz
HIV Diagnosis Rate County: Santa Cruz
7.6
Cases per 100,000 population
(2022)
Compared to:
CA Counties
The distribution is based on data from 58 California counties.
CA Value
(12.2)
The regional value is compared to the California state value.
Prior Value
(6.5)
Prior Value compares a measured value with the previously measured value. Confidence intervals were not taken into account in determining the direction of the comparison.
Trend
This comparison measures the indicator’s values over multiple time periods.<br>The Mann-Kendall Test for Statistical Significance is used to evaluate the trend<br>over 4 to 10 periods of measure, subject to data availability and comparability.
Health / Sexually Transmitted Infections
Persons Living and Diagnosed with HIV who are in Care
Value
Compared to:
Persons Living and Diagnosed with HIV who are in Care County: Santa Cruz
Persons Living and Diagnosed with HIV who are in Care County: Santa Cruz
76.4%
(2022)
Compared to:
CA Counties
The distribution is based on data from 56 California counties.
CA Value
(73.7%)
The regional value is compared to the California state value.
Prior Value
(76.9%)
Prior Value compares a measured value with the previously measured value. Confidence intervals were not taken into account in determining the direction of the comparison.
Trend
This comparison measures the indicator’s values over multiple time periods.<br>The Mann-Kendall Test for Statistical Significance is used to evaluate the trend<br>over 4 to 10 periods of measure, subject to data availability and comparability.
Persons Living with HIV Rate County: Santa Cruz
Persons Living with HIV Rate County: Santa Cruz
201.4
Cases per 100,000 population
(2022)
Compared to:


CA Value
(355.6)
The regional value is compared to the California state value.
Prior Value
(473.9)
Prior Value compares a measured value with the previously measured value. Confidence intervals were not taken into account in determining the direction of the comparison.
Trend
This comparison measures the indicator’s values over multiple time periods.<br>The Mann-Kendall Test for Statistical Significance is used to evaluate the trend<br>over 4 to 10 periods of measure, subject to data availability and comparability.
Education / Student Performance K-12
College/Career Indicator: Prepared County: Santa Cruz
College/Career Indicator: Prepared County: Santa Cruz
12.7%
Percent of cohort
(2023)
Compared to:
Prior Value
(25.1%)
Prior Value compares a measured value with the previously measured value. Confidence intervals were not taken into account in determining the direction of the comparison.
Trend
This comparison measures the indicator’s values over multiple time periods.<br>The Mann-Kendall Test for Statistical Significance is used to evaluate the trend<br>over 4 to 10 periods of measure, subject to data availability and comparability.
Education / School Environment
Annual Public School Enrollment County: Santa Cruz
Annual Public School Enrollment County: Santa Cruz
38,025
Students
(2022-2023)
Compared to:

Prior Value
(38,895)
Prior Value compares a measured value with the previously measured value. Confidence intervals were not taken into account in determining the direction of the comparison.
Trend
This comparison measures the indicator’s values over multiple time periods.<br>The Mann-Kendall Test for Statistical Significance is used to evaluate the trend<br>over 4 to 10 periods of measure, subject to data availability and comparability.
Education / Student Performance K-12
High School Graduation County: Santa Cruz
High School Graduation County: Santa Cruz
86.2%
(2022-2023)
Compared to:
CA Counties
The distribution is based on data from 57 California counties.
CA Value
(86.2%)
The regional value is compared to the California state value.
US Value
(86.5% in 2020)
The regional value is compared to the national value. The source for the national value is National Center for Education Statistics
Prior Value
(86.9%)
Prior Value compares a measured value with the previously measured value. Confidence intervals were not taken into account in determining the direction of the comparison.
Trend
This comparison measures the indicator’s values over multiple time periods.<br>The Mann-Kendall Test for Statistical Significance is used to evaluate the trend<br>over 4 to 10 periods of measure, subject to data availability and comparability.
HP 2030 Target
(90.7%)
Students Who Do Not Complete High School County: Santa Cruz
Students Who Do Not Complete High School County: Santa Cruz
10.4%
(2022-2023)
Compared to:
CA Counties
The distribution is based on data from 57 California counties.
CA Value
(8.2%)
The regional value is compared to the California state value.
Prior Value
(9.3%)
Prior Value compares a measured value with the previously measured value. Confidence intervals were not taken into account in determining the direction of the comparison.
Trend
This comparison measures the indicator’s values over multiple time periods.<br>The Mann-Kendall Test for Statistical Significance is used to evaluate the trend<br>over 4 to 10 periods of measure, subject to data availability and comparability.
Health / Maternal, Fetal & Infant Health
Preterm Births County: Santa Cruz
Preterm Births County: Santa Cruz
7.8%
(2020-2022)
Compared to:
CA Counties
The distribution is based on data from 58 California counties.
CA Value
(9.0%)
The regional value is compared to the California state value.
Prior Value
(7.2%)
Prior Value compares a measured value with the previously measured value. Confidence intervals were taken into account in determining the direction of the comparison.
Trend
This comparison measures the indicator’s values over multiple time periods.<br>The Mann-Kendall Test for Statistical Significance is used to evaluate the trend<br>over 4 to 10 periods of measure, subject to data availability and comparability.
HP 2030 Target
(9.4%)
Community / Public Safety
Community / Public Safety
Age-Adjusted Death Rate due to Motor Vehicle Traffic Collisions
Value
Compared to:
Age-Adjusted Death Rate due to Motor Vehicle Traffic Collisions County: Santa Cruz
Age-Adjusted Death Rate due to Motor Vehicle Traffic Collisions County: Santa Cruz
8.2
Deaths per 100,000 population
(2019-2021)
Compared to:
CA Counties
The distribution is based on data from 57 California counties.
CA Value
(10.7)
The regional value is compared to the California state value.
US Value
(12.0 in 2020)
The regional value is compared to the national value. The source for the national value is Centers for Disease Control and Prevention
Prior Value
(8.3)
Prior Value compares a measured value with the previously measured value. Confidence intervals were taken into account in determining the direction of the comparison.
Trend
This comparison measures the indicator’s values over multiple time periods.<br>The Mann-Kendall Test for Statistical Significance is used to evaluate the trend<br>over 4 to 10 periods of measure, subject to data availability and comparability.
HP 2030 Target
(10.1)
Health / Sexually Transmitted Infections
Chlamydia Incidence Rate County: Santa Cruz
Chlamydia Incidence Rate County: Santa Cruz
318.8
Cases per 100,000 population
(2021)
Compared to:
CA Counties
The distribution is based on data from 58 California counties.
CA Value
(484.7)
The regional value is compared to the California state value.
US Value
(495.5)
The regional value is compared to the national value. The source for the national value is National Center for HIV/AIDS, Viral Hepatitis, STD, and TB Prevention
Prior Value
(277.3)
Prior Value compares a measured value with the previously measured value. Confidence intervals were not taken into account in determining the direction of the comparison.
Trend
This comparison measures the indicator’s values over multiple time periods.<br>The Mann-Kendall Test for Statistical Significance is used to evaluate the trend<br>over 4 to 10 periods of measure, subject to data availability and comparability.
Gonorrhea Incidence Rate County: Santa Cruz
Gonorrhea Incidence Rate County: Santa Cruz
112.5
Cases per 100,000 population
(2021)
Compared to:
CA Counties
The distribution is based on data from 58 California counties.
CA Value
(230.9)
The regional value is compared to the California state value.
US Value
(214.0)
The regional value is compared to the national value. The source for the national value is National Center for HIV/AIDS, Viral Hepatitis, STD, and TB Prevention
Prior Value
(78.1)
Prior Value compares a measured value with the previously measured value. Confidence intervals were not taken into account in determining the direction of the comparison.
Trend
This comparison measures the indicator’s values over multiple time periods.<br>The Mann-Kendall Test for Statistical Significance is used to evaluate the trend<br>over 4 to 10 periods of measure, subject to data availability and comparability.
Syphilis Incidence Rate County: Santa Cruz
Syphilis Incidence Rate County: Santa Cruz
24.7
Cases per 100,000 population
(2021)
Compared to:
CA Counties
The distribution is based on data from 58 California counties.
CA Value
(22.3)
The regional value is compared to the California state value.
US Value
(16.2)
The regional value is compared to the national value. The source for the national value is National Center for HIV/AIDS, Viral Hepatitis, STD, and TB Prevention
Prior Value
(13.3)
Prior Value compares a measured value with the previously measured value. Confidence intervals were not taken into account in determining the direction of the comparison.
Trend
This comparison measures the indicator’s values over multiple time periods.<br>The Mann-Kendall Test for Statistical Significance is used to evaluate the trend<br>over 4 to 10 periods of measure, subject to data availability and comparability.
Economy / Food Insecurity
Adults Receiving Food Stamp Benefits County: Santa Cruz
Adults Receiving Food Stamp Benefits County: Santa Cruz
25.8%
(2021)
Compared to:
CA Counties
The distribution is based on data from 58 California counties.
CA Value
(28.5%)
The regional value is compared to the California state value.
Prior Value
(32.4%)
Prior Value compares a measured value with the previously measured value. Confidence intervals were taken into account in determining the direction of the comparison.
Health / Maternal, Fetal & Infant Health
Any In-Hospital Breastfeeding County: Santa Cruz
Any In-Hospital Breastfeeding County: Santa Cruz
97.7%
(2022)
Compared to:
CA Counties
The distribution is based on data from 58 California counties.
CA Value
(93.8%)
The regional value is compared to the California state value.
Prior Value
(97.6%)
Prior Value compares a measured value with the previously measured value. Confidence intervals were taken into account in determining the direction of the comparison.
Trend
This comparison measures the indicator’s values over multiple time periods.<br>The Mann-Kendall Test for Statistical Significance is used to evaluate the trend<br>over 4 to 10 periods of measure, subject to data availability and comparability.
In-Hospital Exclusive Breastfeeding County: Santa Cruz
In-Hospital Exclusive Breastfeeding County: Santa Cruz
85.4%
(2022)
Compared to:
CA Counties
The distribution is based on data from 58 California counties.
CA Value
(68.5%)
The regional value is compared to the California state value.
Prior Value
(84.0%)
Prior Value compares a measured value with the previously measured value. Confidence intervals were taken into account in determining the direction of the comparison.
Trend
This comparison measures the indicator’s values over multiple time periods.<br>The Mann-Kendall Test for Statistical Significance is used to evaluate the trend<br>over 4 to 10 periods of measure, subject to data availability and comparability.
Environmental Health / Energy & Sustainability
Residential Electricity Use County: Santa Cruz
Residential Electricity Use County: Santa Cruz
2,013.8
KWh
(2022)
Compared to:
CA Counties
The distribution is based on data from 58 California counties.
Prior Value
(2,121.4)
Prior Value compares a measured value with the previously measured value. Confidence intervals were not taken into account in determining the direction of the comparison.
Trend
This comparison measures the indicator’s values over multiple time periods.<br>The Mann-Kendall Test for Statistical Significance is used to evaluate the trend<br>over 4 to 10 periods of measure, subject to data availability and comparability.
Residential Natural Gas Use County: Santa Cruz
Residential Natural Gas Use County: Santa Cruz
116.1
Therms
(2022)
Compared to:
CA Counties
The distribution is based on data from 50 California counties.
Prior Value
(121.2)
Prior Value compares a measured value with the previously measured value. Confidence intervals were not taken into account in determining the direction of the comparison.
Trend
This comparison measures the indicator’s values over multiple time periods.<br>The Mann-Kendall Test for Statistical Significance is used to evaluate the trend<br>over 4 to 10 periods of measure, subject to data availability and comparability.
Economy / Food Insecurity
Households Receiving SNAP with Children (Count) Census Tract: 06087120302
Households Receiving SNAP with Children (Count) Census Tract: 06087120302
18
Households
(2018-2022)
Compared to:

Trend
This comparison measures the indicator’s values over multiple time periods.<br>The Mann-Kendall Test for Statistical Significance is used to evaluate the trend<br>over 4 to 10 periods of measure, subject to data availability and comparability.
Households Receiving SNAP with Children (Count) Census Tract: 06087120400
Households Receiving SNAP with Children (Count) Census Tract: 06087120400
16
Households
(2018-2022)
Compared to:
Trend
This comparison measures the indicator’s values over multiple time periods.<br>The Mann-Kendall Test for Statistical Significance is used to evaluate the trend<br>over 4 to 10 periods of measure, subject to data availability and comparability.
Households Receiving SNAP with Children (Count) Census Tract: 06087120500
Households Receiving SNAP with Children (Count) Census Tract: 06087120500
46
Households
(2018-2022)
Compared to:
Trend
This comparison measures the indicator’s values over multiple time periods.<br>The Mann-Kendall Test for Statistical Significance is used to evaluate the trend<br>over 4 to 10 periods of measure, subject to data availability and comparability.
Households Receiving SNAP with Children (Count) Census Tract: 06087120600
Households Receiving SNAP with Children (Count) Census Tract: 06087120600
24
Households
(2018-2022)
Compared to:
Trend
This comparison measures the indicator’s values over multiple time periods.<br>The Mann-Kendall Test for Statistical Significance is used to evaluate the trend<br>over 4 to 10 periods of measure, subject to data availability and comparability.
Households Receiving SNAP with Children (Count) Census Tract: 06087120700
Households Receiving SNAP with Children (Count) Census Tract: 06087120700
34
Households
(2018-2022)
Compared to:
Trend
This comparison measures the indicator’s values over multiple time periods.<br>The Mann-Kendall Test for Statistical Significance is used to evaluate the trend<br>over 4 to 10 periods of measure, subject to data availability and comparability.
Households Receiving SNAP with Children (Count) Census Tract: 06087120800
Households Receiving SNAP with Children (Count) Census Tract: 06087120800
32
Households
(2018-2022)
Compared to:
Trend
This comparison measures the indicator’s values over multiple time periods.<br>The Mann-Kendall Test for Statistical Significance is used to evaluate the trend<br>over 4 to 10 periods of measure, subject to data availability and comparability.
Households Receiving SNAP with Children (Count) Census Tract: 06087121000
Households Receiving SNAP with Children (Count) Census Tract: 06087121000
0
Households
(2018-2022)
Compared to:
Trend
This comparison measures the indicator’s values over multiple time periods.<br>The Mann-Kendall Test for Statistical Significance is used to evaluate the trend<br>over 4 to 10 periods of measure, subject to data availability and comparability.
Households Receiving SNAP with Children (Count) Census Tract: 06087121100
Households Receiving SNAP with Children (Count) Census Tract: 06087121100
7
Households
(2018-2022)
Compared to:
Trend
This comparison measures the indicator’s values over multiple time periods.<br>The Mann-Kendall Test for Statistical Significance is used to evaluate the trend<br>over 4 to 10 periods of measure, subject to data availability and comparability.
Households Receiving SNAP with Children (Count) Census Tract: 06087121200
Households Receiving SNAP with Children (Count) Census Tract: 06087121200
51
Households
(2018-2022)
Compared to:
Trend
This comparison measures the indicator’s values over multiple time periods.<br>The Mann-Kendall Test for Statistical Significance is used to evaluate the trend<br>over 4 to 10 periods of measure, subject to data availability and comparability.
Households Receiving SNAP with Children (Count) Census Tract: 06087121300
Households Receiving SNAP with Children (Count) Census Tract: 06087121300
32
Households
(2018-2022)
Compared to:
Trend
This comparison measures the indicator’s values over multiple time periods.<br>The Mann-Kendall Test for Statistical Significance is used to evaluate the trend<br>over 4 to 10 periods of measure, subject to data availability and comparability.
Households Receiving SNAP with Children (Count) Census Tract: 06087121401
Households Receiving SNAP with Children (Count) Census Tract: 06087121401
20
Households
(2018-2022)
Compared to:
Trend
This comparison measures the indicator’s values over multiple time periods.<br>The Mann-Kendall Test for Statistical Significance is used to evaluate the trend<br>over 4 to 10 periods of measure, subject to data availability and comparability.
Households Receiving SNAP with Children (Count) Census Tract: 06087121402
Households Receiving SNAP with Children (Count) Census Tract: 06087121402
131
Households
(2018-2022)
Compared to:
Trend
This comparison measures the indicator’s values over multiple time periods.<br>The Mann-Kendall Test for Statistical Significance is used to evaluate the trend<br>over 4 to 10 periods of measure, subject to data availability and comparability.
Households Receiving SNAP with Children (Count) Census Tract: 06087121403
Households Receiving SNAP with Children (Count) Census Tract: 06087121403
28
Households
(2018-2022)
Compared to:
Trend
This comparison measures the indicator’s values over multiple time periods.<br>The Mann-Kendall Test for Statistical Significance is used to evaluate the trend<br>over 4 to 10 periods of measure, subject to data availability and comparability.
Households Receiving SNAP with Children (Count) Census Tract: 06087122001
Households Receiving SNAP with Children (Count) Census Tract: 06087122001
14
Households
(2018-2022)
Compared to:
Trend
This comparison measures the indicator’s values over multiple time periods.<br>The Mann-Kendall Test for Statistical Significance is used to evaluate the trend<br>over 4 to 10 periods of measure, subject to data availability and comparability.
Households Receiving SNAP with Children (Count) Census Tract: 06087122002
Households Receiving SNAP with Children (Count) Census Tract: 06087122002
13
Households
(2018-2022)
Compared to:
Trend
This comparison measures the indicator’s values over multiple time periods.<br>The Mann-Kendall Test for Statistical Significance is used to evaluate the trend<br>over 4 to 10 periods of measure, subject to data availability and comparability.
Households Receiving SNAP with Children (Count) Census Tract: 06087122100
Households Receiving SNAP with Children (Count) Census Tract: 06087122100
85
Households
(2018-2022)
Compared to:
Trend
This comparison measures the indicator’s values over multiple time periods.<br>The Mann-Kendall Test for Statistical Significance is used to evaluate the trend<br>over 4 to 10 periods of measure, subject to data availability and comparability.
Households Receiving SNAP with Children (Count) Census Tract: 06087122202
Households Receiving SNAP with Children (Count) Census Tract: 06087122202
0
Households
(2018-2022)
Compared to:
Trend
This comparison measures the indicator’s values over multiple time periods.<br>The Mann-Kendall Test for Statistical Significance is used to evaluate the trend<br>over 4 to 10 periods of measure, subject to data availability and comparability.
Households Receiving SNAP with Children (Count) Census Tract: 06087122203
Households Receiving SNAP with Children (Count) Census Tract: 06087122203
40
Households
(2018-2022)
Compared to:
Trend
This comparison measures the indicator’s values over multiple time periods.<br>The Mann-Kendall Test for Statistical Significance is used to evaluate the trend<br>over 4 to 10 periods of measure, subject to data availability and comparability.
Households Receiving SNAP with Children (Count) Census Tract: 06087122300
Households Receiving SNAP with Children (Count) Census Tract: 06087122300
0
Households
(2018-2022)
Compared to:
Trend
This comparison measures the indicator’s values over multiple time periods.<br>The Mann-Kendall Test for Statistical Significance is used to evaluate the trend<br>over 4 to 10 periods of measure, subject to data availability and comparability.
Households Receiving SNAP with Children (Count) Census Tract: 06087122500
Households Receiving SNAP with Children (Count) Census Tract: 06087122500
154
Households
(2018-2022)
Compared to:
Trend
This comparison measures the indicator’s values over multiple time periods.<br>The Mann-Kendall Test for Statistical Significance is used to evaluate the trend<br>over 4 to 10 periods of measure, subject to data availability and comparability.
Households Receiving SNAP with Children (Count) Census Tract: 06087123100
Households Receiving SNAP with Children (Count) Census Tract: 06087123100
88
Households
(2018-2022)
Compared to:
Trend
This comparison measures the indicator’s values over multiple time periods.<br>The Mann-Kendall Test for Statistical Significance is used to evaluate the trend<br>over 4 to 10 periods of measure, subject to data availability and comparability.
Households Receiving SNAP with Children (Count) Census Tract: 06087123300
Households Receiving SNAP with Children (Count) Census Tract: 06087123300
26
Households
(2018-2022)
Compared to:
Trend
This comparison measures the indicator’s values over multiple time periods.<br>The Mann-Kendall Test for Statistical Significance is used to evaluate the trend<br>over 4 to 10 periods of measure, subject to data availability and comparability.
Households Receiving SNAP with Children (Count) Census Tract: 06087100100
Households Receiving SNAP with Children (Count) Census Tract: 06087100100
0
Households
(2018-2022)
Compared to:
Trend
This comparison measures the indicator’s values over multiple time periods.<br>The Mann-Kendall Test for Statistical Significance is used to evaluate the trend<br>over 4 to 10 periods of measure, subject to data availability and comparability.
Households Receiving SNAP with Children (Count) Census Tract: 06087100200
Households Receiving SNAP with Children (Count) Census Tract: 06087100200
147
Households
(2018-2022)
Compared to:
Trend
This comparison measures the indicator’s values over multiple time periods.<br>The Mann-Kendall Test for Statistical Significance is used to evaluate the trend<br>over 4 to 10 periods of measure, subject to data availability and comparability.
Households Receiving SNAP with Children (Count) Census Tract: 06087100300
Households Receiving SNAP with Children (Count) Census Tract: 06087100300
22
Households
(2018-2022)
Compared to:
Trend
This comparison measures the indicator’s values over multiple time periods.<br>The Mann-Kendall Test for Statistical Significance is used to evaluate the trend<br>over 4 to 10 periods of measure, subject to data availability and comparability.
Households Receiving SNAP with Children (Count) Census Tract: 06087100400
Households Receiving SNAP with Children (Count) Census Tract: 06087100400
34
Households
(2018-2022)
Compared to:
Trend
This comparison measures the indicator’s values over multiple time periods.<br>The Mann-Kendall Test for Statistical Significance is used to evaluate the trend<br>over 4 to 10 periods of measure, subject to data availability and comparability.
Households Receiving SNAP with Children (Count) Census Tract: 06087100500
Households Receiving SNAP with Children (Count) Census Tract: 06087100500
32
Households
(2018-2022)
Compared to:
Trend
This comparison measures the indicator’s values over multiple time periods.<br>The Mann-Kendall Test for Statistical Significance is used to evaluate the trend<br>over 4 to 10 periods of measure, subject to data availability and comparability.
Households Receiving SNAP with Children (Count) Census Tract: 06087100600
Households Receiving SNAP with Children (Count) Census Tract: 06087100600
9
Households
(2018-2022)
Compared to:
Trend
This comparison measures the indicator’s values over multiple time periods.<br>The Mann-Kendall Test for Statistical Significance is used to evaluate the trend<br>over 4 to 10 periods of measure, subject to data availability and comparability.
Households Receiving SNAP with Children (Count) Census Tract: 06087100700
Households Receiving SNAP with Children (Count) Census Tract: 06087100700
0
Households
(2018-2022)
Compared to:
Trend
This comparison measures the indicator’s values over multiple time periods.<br>The Mann-Kendall Test for Statistical Significance is used to evaluate the trend<br>over 4 to 10 periods of measure, subject to data availability and comparability.
Households Receiving SNAP with Children (Count) Census Tract: 06087100900
Households Receiving SNAP with Children (Count) Census Tract: 06087100900
0
Households
(2018-2022)
Compared to:
Trend
This comparison measures the indicator’s values over multiple time periods.<br>The Mann-Kendall Test for Statistical Significance is used to evaluate the trend<br>over 4 to 10 periods of measure, subject to data availability and comparability.
Households Receiving SNAP with Children (Count) Census Tract: 06087101100
Households Receiving SNAP with Children (Count) Census Tract: 06087101100
10
Households
(2018-2022)
Compared to:
Trend
This comparison measures the indicator’s values over multiple time periods.<br>The Mann-Kendall Test for Statistical Significance is used to evaluate the trend<br>over 4 to 10 periods of measure, subject to data availability and comparability.
Households Receiving SNAP with Children (Count) Census Tract: 06087101200
Households Receiving SNAP with Children (Count) Census Tract: 06087101200
11
Households
(2018-2022)
Compared to:
Trend
This comparison measures the indicator’s values over multiple time periods.<br>The Mann-Kendall Test for Statistical Significance is used to evaluate the trend<br>over 4 to 10 periods of measure, subject to data availability and comparability.
Households Receiving SNAP with Children (Count) Census Tract: 06087110700
Households Receiving SNAP with Children (Count) Census Tract: 06087110700
86
Households
(2018-2022)
Compared to:
Trend
This comparison measures the indicator’s values over multiple time periods.<br>The Mann-Kendall Test for Statistical Significance is used to evaluate the trend<br>over 4 to 10 periods of measure, subject to data availability and comparability.
Households Receiving SNAP with Children (Count) Census Tract: 06087120200
Households Receiving SNAP with Children (Count) Census Tract: 06087120200
52
Households
(2018-2022)
Compared to:
Trend
This comparison measures the indicator’s values over multiple time periods.<br>The Mann-Kendall Test for Statistical Significance is used to evaluate the trend<br>over 4 to 10 periods of measure, subject to data availability and comparability.
Households Receiving SNAP with Children (Count) Census Tract: 06087120301
Households Receiving SNAP with Children (Count) Census Tract: 06087120301
24
Households
(2018-2022)
Compared to:
Trend
This comparison measures the indicator’s values over multiple time periods.<br>The Mann-Kendall Test for Statistical Significance is used to evaluate the trend<br>over 4 to 10 periods of measure, subject to data availability and comparability.
Households Receiving SNAP with Children (Count) Zip Code: 95003
Households Receiving SNAP with Children (Count) Zip Code: 95003
205
Households
(2018-2022)
Compared to:
Trend
This comparison measures the indicator’s values over multiple time periods.<br>The Mann-Kendall Test for Statistical Significance is used to evaluate the trend<br>over 4 to 10 periods of measure, subject to data availability and comparability.
Households Receiving SNAP with Children (Count) Zip Code: 95005
Households Receiving SNAP with Children (Count) Zip Code: 95005
25
Households
(2018-2022)
Compared to:
Trend
This comparison measures the indicator’s values over multiple time periods.<br>The Mann-Kendall Test for Statistical Significance is used to evaluate the trend<br>over 4 to 10 periods of measure, subject to data availability and comparability.
Households Receiving SNAP with Children (Count) Zip Code: 95006
Households Receiving SNAP with Children (Count) Zip Code: 95006
50
Households
(2018-2022)
Compared to:
Trend
This comparison measures the indicator’s values over multiple time periods.<br>The Mann-Kendall Test for Statistical Significance is used to evaluate the trend<br>over 4 to 10 periods of measure, subject to data availability and comparability.
Households Receiving SNAP with Children (Count) Zip Code: 95007
Households Receiving SNAP with Children (Count) Zip Code: 95007
0
Households
(2018-2022)
Compared to:
Trend
This comparison measures the indicator’s values over multiple time periods.<br>The Mann-Kendall Test for Statistical Significance is used to evaluate the trend<br>over 4 to 10 periods of measure, subject to data availability and comparability.
Households Receiving SNAP with Children (Count) Zip Code: 95010
Households Receiving SNAP with Children (Count) Zip Code: 95010
172
Households
(2018-2022)
Compared to:
Trend
This comparison measures the indicator’s values over multiple time periods.<br>The Mann-Kendall Test for Statistical Significance is used to evaluate the trend<br>over 4 to 10 periods of measure, subject to data availability and comparability.
Households Receiving SNAP with Children (Count) Zip Code: 95012
Households Receiving SNAP with Children (Count) Zip Code: 95012
229
Households
(2018-2022)
Compared to:
Trend
This comparison measures the indicator’s values over multiple time periods.<br>The Mann-Kendall Test for Statistical Significance is used to evaluate the trend<br>over 4 to 10 periods of measure, subject to data availability and comparability.
Households Receiving SNAP with Children (Count) Zip Code: 95017
Households Receiving SNAP with Children (Count) Zip Code: 95017
21
Households
(2018-2022)
Compared to:
Trend
This comparison measures the indicator’s values over multiple time periods.<br>The Mann-Kendall Test for Statistical Significance is used to evaluate the trend<br>over 4 to 10 periods of measure, subject to data availability and comparability.
Households Receiving SNAP with Children (Count) Zip Code: 95018
Households Receiving SNAP with Children (Count) Zip Code: 95018
67
Households
(2018-2022)
Compared to:
Trend
This comparison measures the indicator’s values over multiple time periods.<br>The Mann-Kendall Test for Statistical Significance is used to evaluate the trend<br>over 4 to 10 periods of measure, subject to data availability and comparability.
Households Receiving SNAP with Children (Count) Zip Code: 95019
Households Receiving SNAP with Children (Count) Zip Code: 95019
372
Households
(2018-2022)
Compared to:
Trend
This comparison measures the indicator’s values over multiple time periods.<br>The Mann-Kendall Test for Statistical Significance is used to evaluate the trend<br>over 4 to 10 periods of measure, subject to data availability and comparability.
Households Receiving SNAP with Children (Count) Zip Code: 95033
Households Receiving SNAP with Children (Count) Zip Code: 95033
12
Households
(2018-2022)
Compared to:
Trend
This comparison measures the indicator’s values over multiple time periods.<br>The Mann-Kendall Test for Statistical Significance is used to evaluate the trend<br>over 4 to 10 periods of measure, subject to data availability and comparability.
Households Receiving SNAP with Children (Count) Zip Code: 95041
Households Receiving SNAP with Children (Count) Zip Code: 95041
0
Households
(2018-2022)
Compared to:
Trend
This comparison measures the indicator’s values over multiple time periods.<br>The Mann-Kendall Test for Statistical Significance is used to evaluate the trend<br>over 4 to 10 periods of measure, subject to data availability and comparability.
Households Receiving SNAP with Children (Count) Zip Code: 95060
Households Receiving SNAP with Children (Count) Zip Code: 95060
523
Households
(2018-2022)
Compared to:
Trend
This comparison measures the indicator’s values over multiple time periods.<br>The Mann-Kendall Test for Statistical Significance is used to evaluate the trend<br>over 4 to 10 periods of measure, subject to data availability and comparability.
Households Receiving SNAP with Children (Count) Zip Code: 95062
Households Receiving SNAP with Children (Count) Zip Code: 95062
365
Households
(2018-2022)
Compared to:
Trend
This comparison measures the indicator’s values over multiple time periods.<br>The Mann-Kendall Test for Statistical Significance is used to evaluate the trend<br>over 4 to 10 periods of measure, subject to data availability and comparability.
Households Receiving SNAP with Children (Count) Zip Code: 95064
Households Receiving SNAP with Children (Count) Zip Code: 95064
34
Households
(2018-2022)
Compared to:
Trend
This comparison measures the indicator’s values over multiple time periods.<br>The Mann-Kendall Test for Statistical Significance is used to evaluate the trend<br>over 4 to 10 periods of measure, subject to data availability and comparability.
Households Receiving SNAP with Children (Count) Zip Code: 95065
Households Receiving SNAP with Children (Count) Zip Code: 95065
32
Households
(2018-2022)
Compared to:
Trend
This comparison measures the indicator’s values over multiple time periods.<br>The Mann-Kendall Test for Statistical Significance is used to evaluate the trend<br>over 4 to 10 periods of measure, subject to data availability and comparability.
Households Receiving SNAP with Children (Count) Zip Code: 95066
Households Receiving SNAP with Children (Count) Zip Code: 95066
26
Households
(2018-2022)
Compared to:
Trend
This comparison measures the indicator’s values over multiple time periods.<br>The Mann-Kendall Test for Statistical Significance is used to evaluate the trend<br>over 4 to 10 periods of measure, subject to data availability and comparability.
Households Receiving SNAP with Children (Count) Zip Code: 95073
Households Receiving SNAP with Children (Count) Zip Code: 95073
76
Households
(2018-2022)
Compared to:
Trend
This comparison measures the indicator’s values over multiple time periods.<br>The Mann-Kendall Test for Statistical Significance is used to evaluate the trend<br>over 4 to 10 periods of measure, subject to data availability and comparability.
Households Receiving SNAP with Children (Count) Zip Code: 95076
Households Receiving SNAP with Children (Count) Zip Code: 95076
2,524
Households
(2018-2022)
Compared to:
Trend
This comparison measures the indicator’s values over multiple time periods.<br>The Mann-Kendall Test for Statistical Significance is used to evaluate the trend<br>over 4 to 10 periods of measure, subject to data availability and comparability.
Students Eligible for the Free Lunch Program County: Santa Cruz
Students Eligible for the Free Lunch Program County: Santa Cruz
45.7%
(2022-2023)
Compared to:
CA Counties
The distribution is based on data from 58 California counties.
U.S. Counties
The distribution is based on data from 2,710 U.S. counties and county equivalents.
CA Value
(52.6%)
The regional value is compared to the California state value.
US Value
(42.8%)
The regional value is compared to the national value.
Prior Value
(43.8%)
Prior Value compares a measured value with the previously measured value. Confidence intervals were not taken into account in determining the direction of the comparison.
Trend
This comparison measures the indicator’s values over multiple time periods.<br>The Mann-Kendall Test for Statistical Significance is used to evaluate the trend<br>over 4 to 10 periods of measure, subject to data availability and comparability.
Education / School Environment
Student-to-Teacher Ratio County: Santa Cruz
Student-to-Teacher Ratio County: Santa Cruz
21.2
Students per teacher
(2022-2023)
Compared to:
CA Counties
The distribution is based on data from 58 California counties.
U.S. Counties
The distribution is based on data from 3,125 U.S. counties and county equivalents.
CA Value
(21.9)
The regional value is compared to the California state value.
US Value
(15.4)
The regional value is compared to the national value.
Prior Value
(21.5)
Prior Value compares a measured value with the previously measured value. Confidence intervals were not taken into account in determining the direction of the comparison.
Trend
This comparison measures the indicator’s values over multiple time periods.<br>The Mann-Kendall Test for Statistical Significance is used to evaluate the trend<br>over 4 to 10 periods of measure, subject to data availability and comparability.
Economy / Poverty
People 65+ Living Below Poverty Level (Count) Census Tract: 06087100100
People 65+ Living Below Poverty Level (Count) Census Tract: 06087100100
23
People
(2018-2022)
Compared to:
Trend
This comparison measures the indicator’s values over multiple time periods.<br>The Mann-Kendall Test for Statistical Significance is used to evaluate the trend<br>over 4 to 10 periods of measure, subject to data availability and comparability.
People 65+ Living Below Poverty Level (Count) Census Tract: 06087100200
People 65+ Living Below Poverty Level (Count) Census Tract: 06087100200
166
People
(2018-2022)
Compared to:
Trend
This comparison measures the indicator’s values over multiple time periods.<br>The Mann-Kendall Test for Statistical Significance is used to evaluate the trend<br>over 4 to 10 periods of measure, subject to data availability and comparability.
People 65+ Living Below Poverty Level (Count) Census Tract: 06087100300
People 65+ Living Below Poverty Level (Count) Census Tract: 06087100300
20
People
(2018-2022)
Compared to:
Trend
This comparison measures the indicator’s values over multiple time periods.<br>The Mann-Kendall Test for Statistical Significance is used to evaluate the trend<br>over 4 to 10 periods of measure, subject to data availability and comparability.
People 65+ Living Below Poverty Level (Count) Census Tract: 06087100400
People 65+ Living Below Poverty Level (Count) Census Tract: 06087100400
4
People
(2018-2022)
Compared to:
Trend
This comparison measures the indicator’s values over multiple time periods.<br>The Mann-Kendall Test for Statistical Significance is used to evaluate the trend<br>over 4 to 10 periods of measure, subject to data availability and comparability.
People 65+ Living Below Poverty Level (Count) Census Tract: 06087100500
People 65+ Living Below Poverty Level (Count) Census Tract: 06087100500
0
People
(2018-2022)
Compared to:
Trend
This comparison measures the indicator’s values over multiple time periods.<br>The Mann-Kendall Test for Statistical Significance is used to evaluate the trend<br>over 4 to 10 periods of measure, subject to data availability and comparability.
People 65+ Living Below Poverty Level (Count) Census Tract: 06087100600
People 65+ Living Below Poverty Level (Count) Census Tract: 06087100600
38
People
(2018-2022)
Compared to:
Trend
This comparison measures the indicator’s values over multiple time periods.<br>The Mann-Kendall Test for Statistical Significance is used to evaluate the trend<br>over 4 to 10 periods of measure, subject to data availability and comparability.
People 65+ Living Below Poverty Level (Count) Census Tract: 06087100700
People 65+ Living Below Poverty Level (Count) Census Tract: 06087100700
55
People
(2018-2022)
Compared to:
Trend
This comparison measures the indicator’s values over multiple time periods.<br>The Mann-Kendall Test for Statistical Significance is used to evaluate the trend<br>over 4 to 10 periods of measure, subject to data availability and comparability.
People 65+ Living Below Poverty Level (Count) Census Tract: 06087100900
People 65+ Living Below Poverty Level (Count) Census Tract: 06087100900
25
People
(2018-2022)
Compared to:
Trend
This comparison measures the indicator’s values over multiple time periods.<br>The Mann-Kendall Test for Statistical Significance is used to evaluate the trend<br>over 4 to 10 periods of measure, subject to data availability and comparability.
People 65+ Living Below Poverty Level (Count) Census Tract: 06087101100
People 65+ Living Below Poverty Level (Count) Census Tract: 06087101100
161
People
(2018-2022)
Compared to:
Trend
This comparison measures the indicator’s values over multiple time periods.<br>The Mann-Kendall Test for Statistical Significance is used to evaluate the trend<br>over 4 to 10 periods of measure, subject to data availability and comparability.
People 65+ Living Below Poverty Level (Count) Census Tract: 06087101200
People 65+ Living Below Poverty Level (Count) Census Tract: 06087101200
76
People
(2018-2022)
Compared to:
Trend
This comparison measures the indicator’s values over multiple time periods.<br>The Mann-Kendall Test for Statistical Significance is used to evaluate the trend<br>over 4 to 10 periods of measure, subject to data availability and comparability.
People 65+ Living Below Poverty Level (Count) Census Tract: 06087110700
People 65+ Living Below Poverty Level (Count) Census Tract: 06087110700
75
People
(2018-2022)
Compared to:
Trend
This comparison measures the indicator’s values over multiple time periods.<br>The Mann-Kendall Test for Statistical Significance is used to evaluate the trend<br>over 4 to 10 periods of measure, subject to data availability and comparability.
People 65+ Living Below Poverty Level (Count) Census Tract: 06087120200
People 65+ Living Below Poverty Level (Count) Census Tract: 06087120200
73
People
(2018-2022)
Compared to:
Trend
This comparison measures the indicator’s values over multiple time periods.<br>The Mann-Kendall Test for Statistical Significance is used to evaluate the trend<br>over 4 to 10 periods of measure, subject to data availability and comparability.
People 65+ Living Below Poverty Level (Count) Census Tract: 06087120301
People 65+ Living Below Poverty Level (Count) Census Tract: 06087120301
37
People
(2018-2022)
Compared to:
Trend
This comparison measures the indicator’s values over multiple time periods.<br>The Mann-Kendall Test for Statistical Significance is used to evaluate the trend<br>over 4 to 10 periods of measure, subject to data availability and comparability.
People 65+ Living Below Poverty Level (Count) Census Tract: 06087120302
People 65+ Living Below Poverty Level (Count) Census Tract: 06087120302
42
People
(2018-2022)
Compared to:
Trend
This comparison measures the indicator’s values over multiple time periods.<br>The Mann-Kendall Test for Statistical Significance is used to evaluate the trend<br>over 4 to 10 periods of measure, subject to data availability and comparability.
People 65+ Living Below Poverty Level (Count) Census Tract: 06087120400
People 65+ Living Below Poverty Level (Count) Census Tract: 06087120400
53
People
(2018-2022)
Compared to:
Trend
This comparison measures the indicator’s values over multiple time periods.<br>The Mann-Kendall Test for Statistical Significance is used to evaluate the trend<br>over 4 to 10 periods of measure, subject to data availability and comparability.
People 65+ Living Below Poverty Level (Count) Census Tract: 06087120500
People 65+ Living Below Poverty Level (Count) Census Tract: 06087120500
26
People
(2018-2022)
Compared to:
Trend
This comparison measures the indicator’s values over multiple time periods.<br>The Mann-Kendall Test for Statistical Significance is used to evaluate the trend<br>over 4 to 10 periods of measure, subject to data availability and comparability.
People 65+ Living Below Poverty Level (Count) Census Tract: 06087120600
People 65+ Living Below Poverty Level (Count) Census Tract: 06087120600
119
People
(2018-2022)
Compared to:
Trend
This comparison measures the indicator’s values over multiple time periods.<br>The Mann-Kendall Test for Statistical Significance is used to evaluate the trend<br>over 4 to 10 periods of measure, subject to data availability and comparability.
People 65+ Living Below Poverty Level (Count) Census Tract: 06087120700
People 65+ Living Below Poverty Level (Count) Census Tract: 06087120700
15
People
(2018-2022)
Compared to:
Trend
This comparison measures the indicator’s values over multiple time periods.<br>The Mann-Kendall Test for Statistical Significance is used to evaluate the trend<br>over 4 to 10 periods of measure, subject to data availability and comparability.
People 65+ Living Below Poverty Level (Count) Census Tract: 06087120800
People 65+ Living Below Poverty Level (Count) Census Tract: 06087120800
50
People
(2018-2022)
Compared to:
Trend
This comparison measures the indicator’s values over multiple time periods.<br>The Mann-Kendall Test for Statistical Significance is used to evaluate the trend<br>over 4 to 10 periods of measure, subject to data availability and comparability.
People 65+ Living Below Poverty Level (Count) Census Tract: 06087121000
People 65+ Living Below Poverty Level (Count) Census Tract: 06087121000
44
People
(2018-2022)
Compared to:
Trend
This comparison measures the indicator’s values over multiple time periods.<br>The Mann-Kendall Test for Statistical Significance is used to evaluate the trend<br>over 4 to 10 periods of measure, subject to data availability and comparability.
People 65+ Living Below Poverty Level (Count) Census Tract: 06087121100
People 65+ Living Below Poverty Level (Count) Census Tract: 06087121100
80
People
(2018-2022)
Compared to:
Trend
This comparison measures the indicator’s values over multiple time periods.<br>The Mann-Kendall Test for Statistical Significance is used to evaluate the trend<br>over 4 to 10 periods of measure, subject to data availability and comparability.
People 65+ Living Below Poverty Level (Count) Census Tract: 06087121200
People 65+ Living Below Poverty Level (Count) Census Tract: 06087121200
32
People
(2018-2022)
Compared to:
Trend
This comparison measures the indicator’s values over multiple time periods.<br>The Mann-Kendall Test for Statistical Significance is used to evaluate the trend<br>over 4 to 10 periods of measure, subject to data availability and comparability.
People 65+ Living Below Poverty Level (Count) Census Tract: 06087121300
People 65+ Living Below Poverty Level (Count) Census Tract: 06087121300
16
People
(2018-2022)
Compared to:
Trend
This comparison measures the indicator’s values over multiple time periods.<br>The Mann-Kendall Test for Statistical Significance is used to evaluate the trend<br>over 4 to 10 periods of measure, subject to data availability and comparability.
People 65+ Living Below Poverty Level (Count) Census Tract: 06087121401
People 65+ Living Below Poverty Level (Count) Census Tract: 06087121401
94
People
(2018-2022)
Compared to:
Trend
This comparison measures the indicator’s values over multiple time periods.<br>The Mann-Kendall Test for Statistical Significance is used to evaluate the trend<br>over 4 to 10 periods of measure, subject to data availability and comparability.
People 65+ Living Below Poverty Level (Count) Census Tract: 06087121402
People 65+ Living Below Poverty Level (Count) Census Tract: 06087121402
50
People
(2018-2022)
Compared to:
Trend
This comparison measures the indicator’s values over multiple time periods.<br>The Mann-Kendall Test for Statistical Significance is used to evaluate the trend<br>over 4 to 10 periods of measure, subject to data availability and comparability.
People 65+ Living Below Poverty Level (Count) Census Tract: 06087121403
People 65+ Living Below Poverty Level (Count) Census Tract: 06087121403
75
People
(2018-2022)
Compared to:
Trend
This comparison measures the indicator’s values over multiple time periods.<br>The Mann-Kendall Test for Statistical Significance is used to evaluate the trend<br>over 4 to 10 periods of measure, subject to data availability and comparability.
People 65+ Living Below Poverty Level (Count) Census Tract: 06087122001
People 65+ Living Below Poverty Level (Count) Census Tract: 06087122001
35
People
(2018-2022)
Compared to:
Trend
This comparison measures the indicator’s values over multiple time periods.<br>The Mann-Kendall Test for Statistical Significance is used to evaluate the trend<br>over 4 to 10 periods of measure, subject to data availability and comparability.
People 65+ Living Below Poverty Level (Count) Census Tract: 06087122002
People 65+ Living Below Poverty Level (Count) Census Tract: 06087122002
40
People
(2018-2022)
Compared to:
Trend
This comparison measures the indicator’s values over multiple time periods.<br>The Mann-Kendall Test for Statistical Significance is used to evaluate the trend<br>over 4 to 10 periods of measure, subject to data availability and comparability.
People 65+ Living Below Poverty Level (Count) Census Tract: 06087122100
People 65+ Living Below Poverty Level (Count) Census Tract: 06087122100
68
People
(2018-2022)
Compared to:
Trend
This comparison measures the indicator’s values over multiple time periods.<br>The Mann-Kendall Test for Statistical Significance is used to evaluate the trend<br>over 4 to 10 periods of measure, subject to data availability and comparability.
People 65+ Living Below Poverty Level (Count) Census Tract: 06087122202
People 65+ Living Below Poverty Level (Count) Census Tract: 06087122202
15
People
(2018-2022)
Compared to:
Trend
This comparison measures the indicator’s values over multiple time periods.<br>The Mann-Kendall Test for Statistical Significance is used to evaluate the trend<br>over 4 to 10 periods of measure, subject to data availability and comparability.
People 65+ Living Below Poverty Level (Count) Census Tract: 06087122203
People 65+ Living Below Poverty Level (Count) Census Tract: 06087122203
64
People
(2018-2022)
Compared to:
Trend
This comparison measures the indicator’s values over multiple time periods.<br>The Mann-Kendall Test for Statistical Significance is used to evaluate the trend<br>over 4 to 10 periods of measure, subject to data availability and comparability.
People 65+ Living Below Poverty Level (Count) Census Tract: 06087122300
People 65+ Living Below Poverty Level (Count) Census Tract: 06087122300
0
People
(2018-2022)
Compared to:
Trend
This comparison measures the indicator’s values over multiple time periods.<br>The Mann-Kendall Test for Statistical Significance is used to evaluate the trend<br>over 4 to 10 periods of measure, subject to data availability and comparability.
People 65+ Living Below Poverty Level (Count) Census Tract: 06087122500
People 65+ Living Below Poverty Level (Count) Census Tract: 06087122500
116
People
(2018-2022)
Compared to:
Trend
This comparison measures the indicator’s values over multiple time periods.<br>The Mann-Kendall Test for Statistical Significance is used to evaluate the trend<br>over 4 to 10 periods of measure, subject to data availability and comparability.
People 65+ Living Below Poverty Level (Count) Census Tract: 06087123100
People 65+ Living Below Poverty Level (Count) Census Tract: 06087123100
21
People
(2018-2022)
Compared to:
Trend
This comparison measures the indicator’s values over multiple time periods.<br>The Mann-Kendall Test for Statistical Significance is used to evaluate the trend<br>over 4 to 10 periods of measure, subject to data availability and comparability.
People 65+ Living Below Poverty Level (Count) Census Tract: 06087123300
People 65+ Living Below Poverty Level (Count) Census Tract: 06087123300
7
People
(2018-2022)
Compared to:
Trend
This comparison measures the indicator’s values over multiple time periods.<br>The Mann-Kendall Test for Statistical Significance is used to evaluate the trend<br>over 4 to 10 periods of measure, subject to data availability and comparability.
People 65+ Living Below Poverty Level (Count) Zip Code: 95003
People 65+ Living Below Poverty Level (Count) Zip Code: 95003
285
People
(2018-2022)
Compared to:
Trend
This comparison measures the indicator’s values over multiple time periods.<br>The Mann-Kendall Test for Statistical Significance is used to evaluate the trend<br>over 4 to 10 periods of measure, subject to data availability and comparability.
People 65+ Living Below Poverty Level (Count) Zip Code: 95005
People 65+ Living Below Poverty Level (Count) Zip Code: 95005
81
People
(2018-2022)
Compared to:
Trend
This comparison measures the indicator’s values over multiple time periods.<br>The Mann-Kendall Test for Statistical Significance is used to evaluate the trend<br>over 4 to 10 periods of measure, subject to data availability and comparability.
People 65+ Living Below Poverty Level (Count) Zip Code: 95006
People 65+ Living Below Poverty Level (Count) Zip Code: 95006
73
People
(2018-2022)
Compared to:
Trend
This comparison measures the indicator’s values over multiple time periods.<br>The Mann-Kendall Test for Statistical Significance is used to evaluate the trend<br>over 4 to 10 periods of measure, subject to data availability and comparability.
